Figures & data
Table 1. The 58 Alabama counties used in the case study and their 2016 estimated populations
Table 2. Power laws* associated with the population numbers of 58 small (<120,000 persons) Alabama counties
Table 3. Power laws* associated with the enterprise numbers of 58 small (<120,000 persons) Alabama counties
Table 4. Power laws* associated with the enterprise richness of 58 small (<120,000 persons) Alabama counties
Table 5. Power laws* associated with the gross domestic products (GDPs) of 58 small (<120,000 persons) Alabama counties
Table 6. Power laws* associated with the number of highly educated people in 58 small (<120,000 persons) Alabama counties
Table 7. Power laws* associated with the size of payrolls in 58 small (<120,000 persons) Alabama counties
Table 8. Power laws* associated with total income in 58 small (<120,000 persons) Alabama counties
Table 9. Power laws* associated with the number of officially poor people in 58 small (<120,000 persons) Alabama counties
Table 10. Power laws* associated with the enterprise dependency indices of 58 small (<120,000 persons) Alabama counties
Figure 1. The requirement for new and existing entrepreneurial types in Alabama counties of different sizes (measured as total enterprise numbers). Triangles (new entrepreneurs) and circles (existing entrepreneurs) represent actual entrepreneurial activities in the counties.
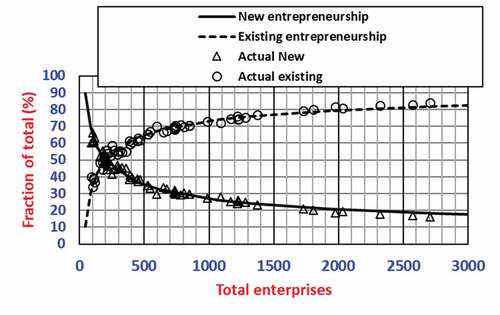
Figure 2. The potential impact of a single additional enterprise type on additional enterprises (circles) and additional jobs (triangles) in Alabama counties of different sizes. Power laws were used to calculate the values.
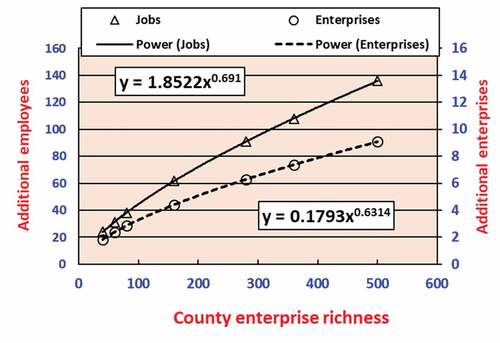
Figure 3. The levels of poverty, unemployment and higher education in relation to the population sizes of Alabama counties. Power laws were used to calculate values, which were then expressed as percentages of the total population.
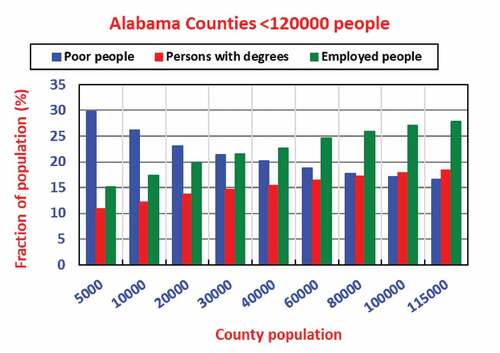
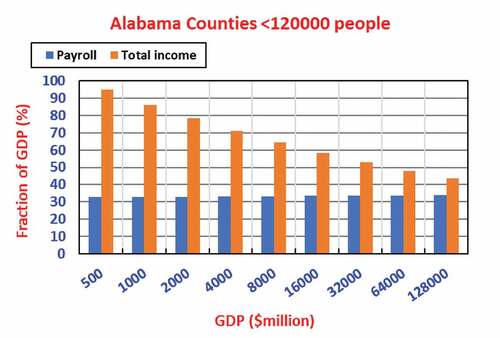
Figure 4. The total income of and payrolls in Alabama counties relative to the magnitude of their gross domestic products (GDPs). Power laws were used to calculate values, which were then expressed as fractions.