
Figures & data
Figure 1. Study area map with selected clusters
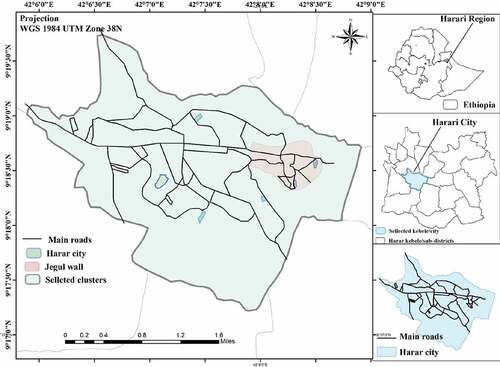
Figure 2. Conceptual framework of the study
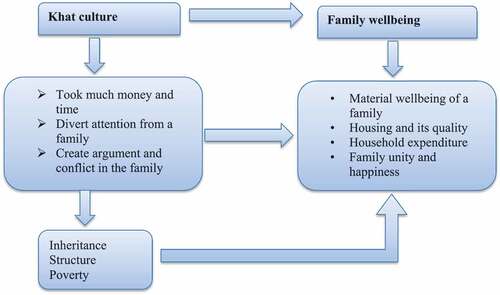
Table 1. Marital status and family size of the respondents
Table 2. Religion and ethnic composition of the respondents
Table 3. Some indicators of material well-being: ownership of home materials
Figure 3. Ownership of some basic home materials: consumer vs. non-consumer
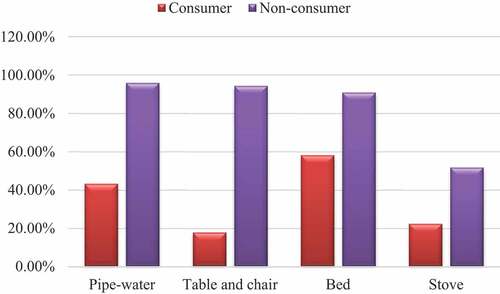
Figure 4. Ownership of house residence
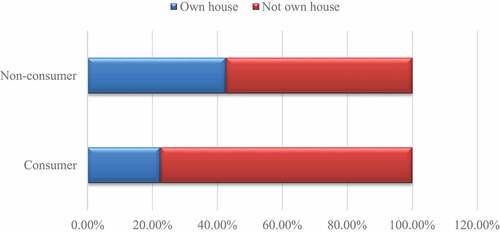
Table 4. Comparison of the frequency of food consumption and having a good time
Figure 5. Planning family life: consumer vs non-consumer households
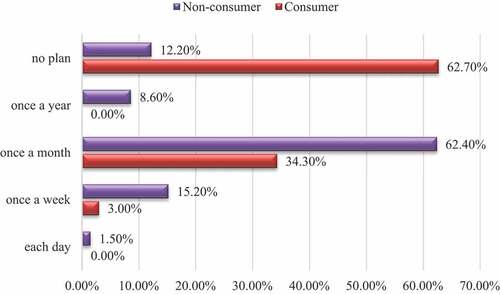
Figure 6. Expenditure for basic family needs vs. khat ceremony
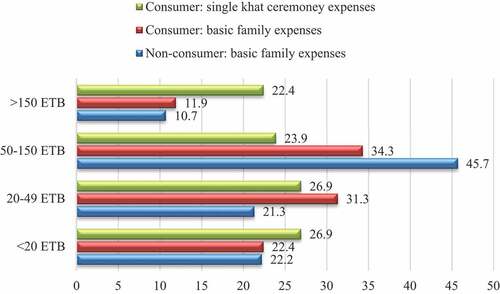
Figure 7. Additional burden on chewer families
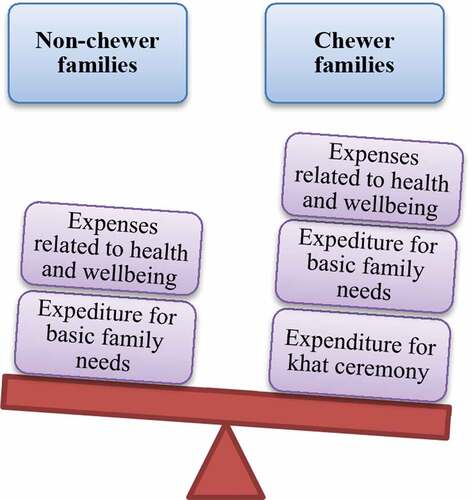
Figure 8. Emergency money: consumer vs. non-consumer
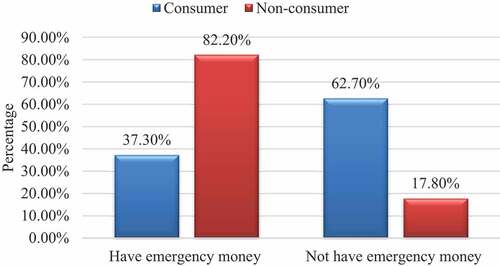
Table 1. The houses and its surroundings of chewer and non-chewers
Table 2. Data from Non-chewers who live with Chewers
Table 3. Management of Income and Expenditure by a Household where either Husband or Wife is non-chewer, Data from a non-chewer family member