
Figures & data
Table 1. Percentage distribution of married women by selected socioeconomic and demographic characteristics on relationship status
Figure 1. Schematic framework showing the percentage distribution of children ever born by relationship status. Source: Authors’ computation from SADHS (Citation2016)
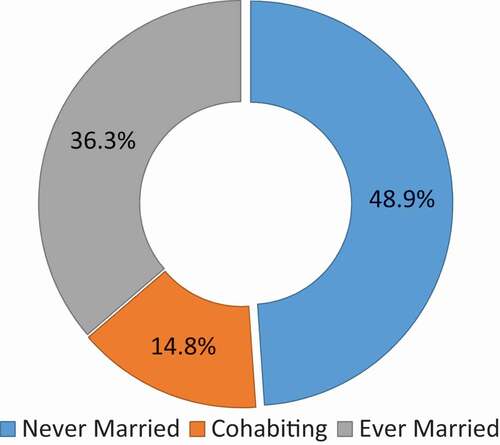
Table 2. Mean number of children ever born to women by selected sociodemographic factors
Table 3. Bivariate association of socioeconomic and demographic characteristics and fertility with relationship status
Table 4. Multivariate model using binary logistic regression technique predicting fertility by relationship status controlling for selected socioeconomic characteristics