Figures & data
Figure 1. IPA model.(Source: Martilla & James, Citation1977).
Table 1. Quadrant and implication of IPA
Figure 2. Location of Da Nang city, Vietnam.
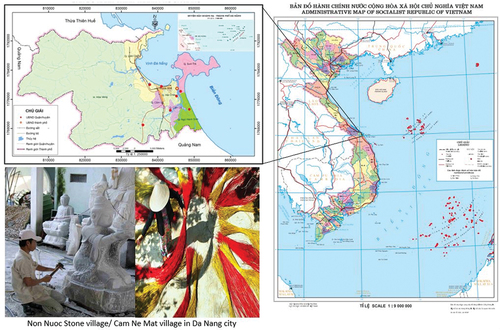
Figure 3. The numbers of international tourists visiting to Da Nang annually.
Source: Da Nang Office of Tourism—Information
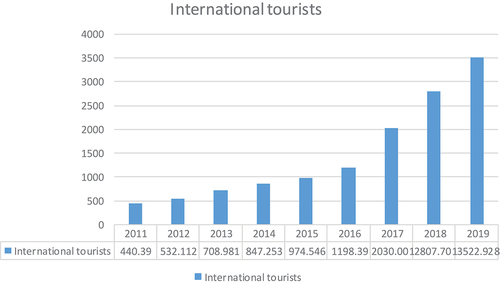
Figure 4. Research process.
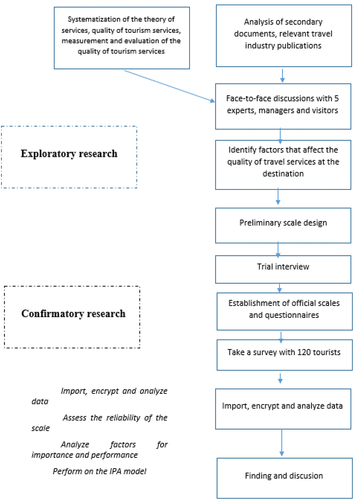
Table 2. Demographic characteristics of respondents in Da Nang’s traditional craft villages
Table 3. Cronbach Alpha and corrected item-total correlation
Table 4. KMO and bartlett’s test
Table 5. Rotated component matrix
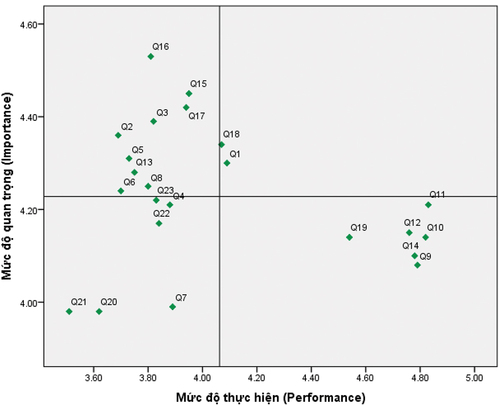
Table 6. Importance—performance analysis for TSQ in Da Nang’ traditional craft villages
Figure 5. IPA graph.