
Figures & data
Figure 1. Location map of Tana Zuria and Tana Zuria rice livelihood zones.
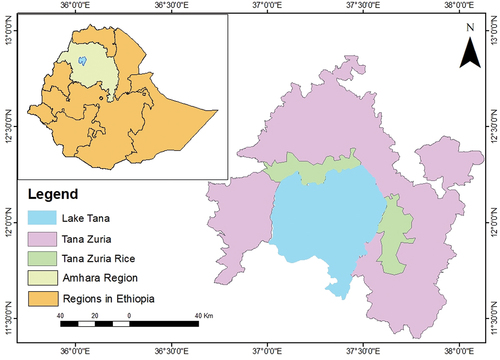
Table 1. Description of variables used for livelihood asset index
Figure 2. Two-stage livelihoods asset index development.
Table 2. Summary of livelihood assets index result
Figure 3. The six livelihood asset score of households across livelihood zones.
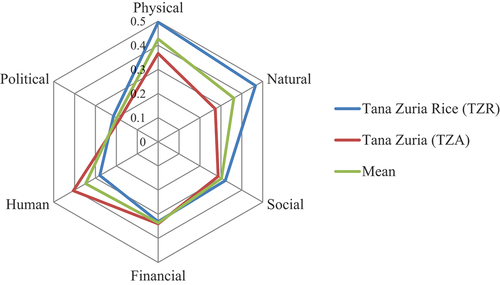
Figure 4. Overall asset index score of sample RKAs.
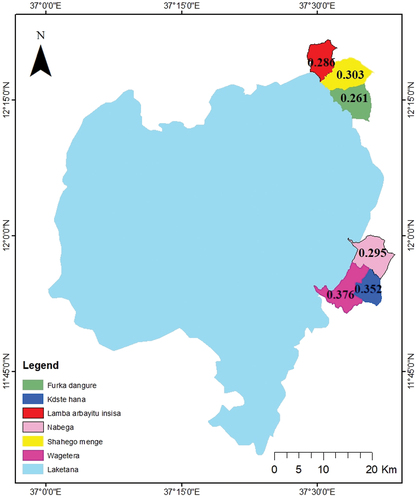
Table 3. Livelihood assets quintile across the livelihood zones
Table 4. Distribution of number of livelihood strategies across the livelihood zones
Figure 5. Household’s engagement in livelihoods strategies across the livelihood groups.
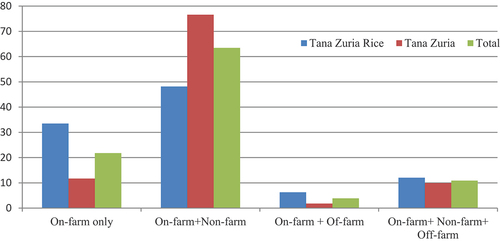
Table 5. Summary of mean annual income from livelihood strategies in ETB
Table 6. Livelihood diversification distribution of households via livelihood zones
Table 7. Distribution of asset and income of households on diversification groups
Table A1. Summary of principal component analysis results