
Figures & data
Figure 1. Gender differences in the percentage of female- and male-authored articles published across five journals and the full-time female teachers (2011 to 2020).
Note: source of full-time female teachers comes from the annual reports released by the ministry of education of the people’s republic of China 2011–2020 (Ministry of Education, Citation2021)
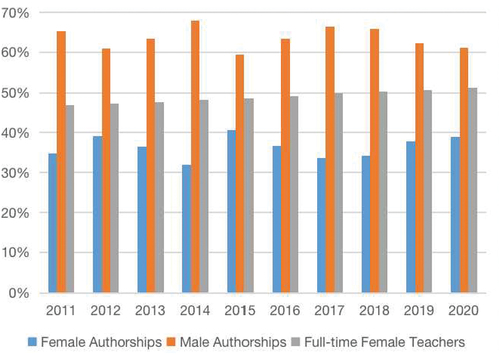
Figure 2. Gender differences in publication rates of each journal (2011- 2020).
Note: the layout of each journal is sequenced as that of 2011
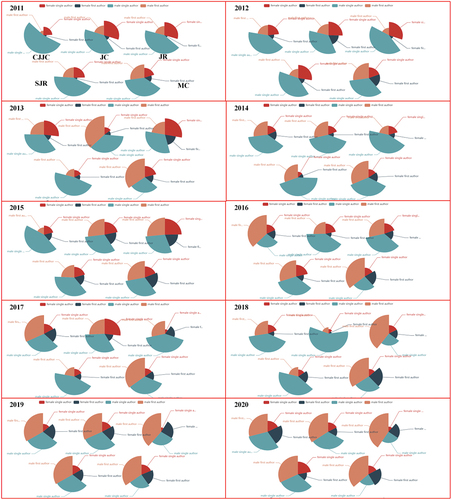
Table 1. The most prolific scholars (top one percent)
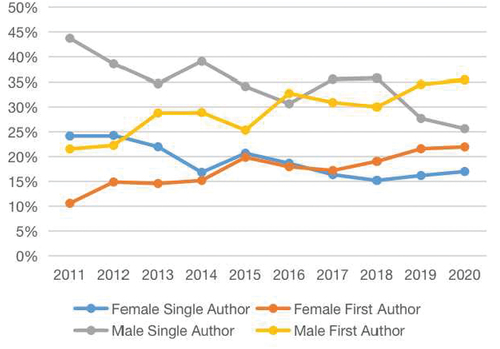
Figure 3. Gender differences in the publication rates of total articles (2011–2020).
Data availability statement
The raw data supporting the conclusions of this article will be made available by the authors, without undue reservation. Further inquiries can be directed to the corresponding author. The raw data is stored https://www.researchgate.net/publication/367165372_the_raw_data