
Figures & data
Figure 1. Conceptual framework and hypotheses.
Table 1. Descriptive statistics of variables
Figure 2. (a) Geographic locations of the study areas and metropolises (left panel). (b) Quantile map of non-agriculture share in study areas of Vietnam 2018 (right panel).
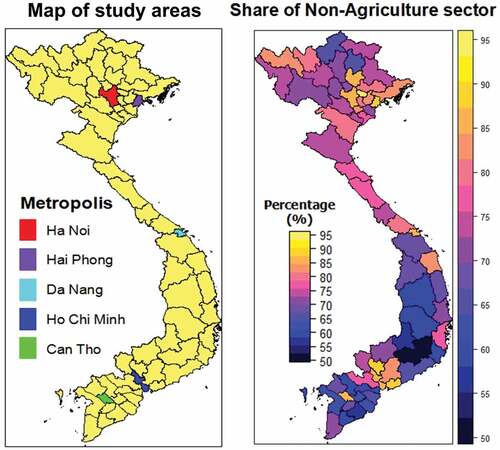
Figure 3. Moran Scatter plot of non-agriculture share in provinces of Vietnam 2018.
Table 2. Moran’s test of the spatial autocorrelation of non-agriculture share in provinces of Vietnam
Table 3. Lagrange multiplier and Robust tests
Table 4. Spatial panel data model
Table 5. Direct, indirect and total effects (estimation results for SAR model)