
Figures & data
Figure 1. International Trade of Thailand between 2002 to 2021.
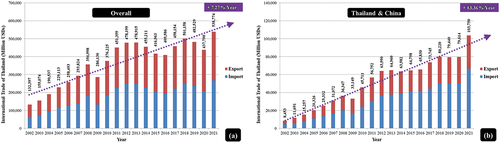
Figure 2. Thailand – China Land Transport (R3A, R8, R9, and R12).
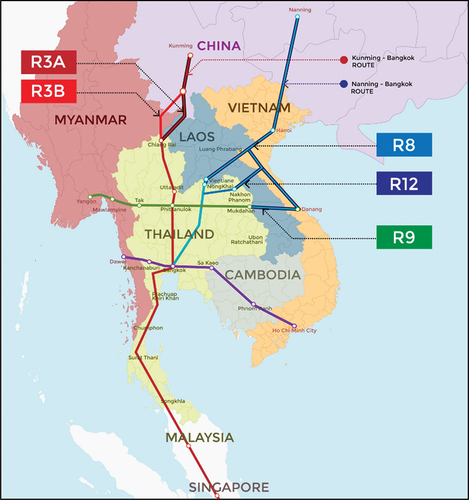
Table 1. Thailand and China Competitiveness Rankings in 2022
Table 2. Key-Informants of In-depth Interviews
Figure 3. R3A Route Time-Cost-Distance Analysis.
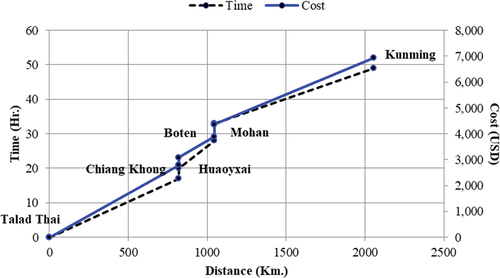
Figure 4. R8 Route Time-Cost-Distance Analysis.
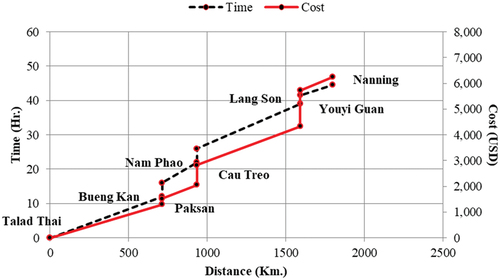
Figure 5. R9 Route Time-Cost-Distance Analysis.
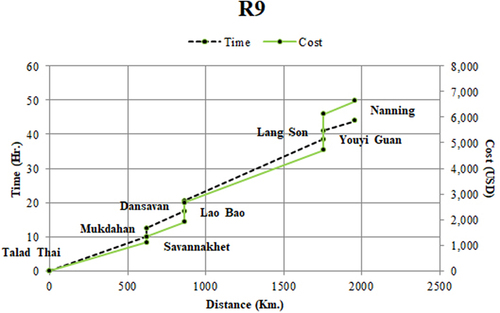
Figure 6. R12 Route Time-Cost-Distance Analysis.
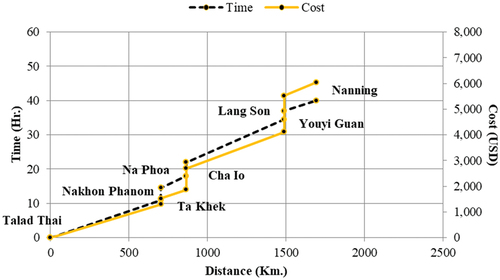
Table 3. Route Conditions of Thailand-China Routes
Table 4. Cost-Distance Comparison of Thailand-China Routes
Table 5. Time-Distance Comparison of Thailand-China Routes
Table 6. Time-Cost-Distance of R3A Route
Table 7. Time-Cost-Distance of R8 Route
Table 8. Time-Cost-Distance of R9 Route
Table 9. Time-Cost-Distance of R12 Route
Figure 7. Cost-Distance Analysis.
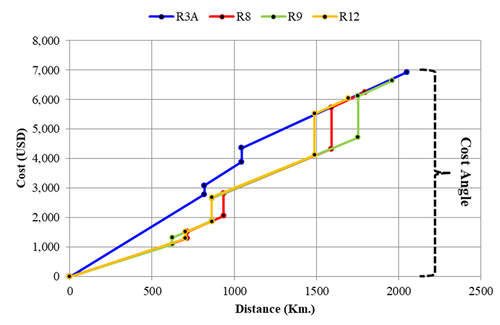
Figure 8. Cost Analysis (USD).
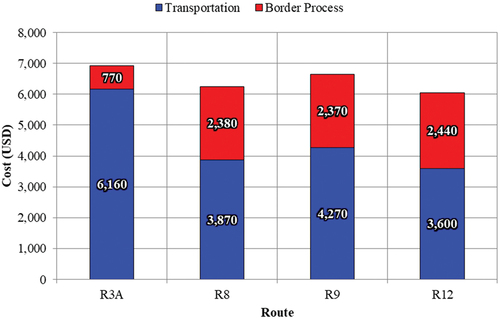
Figure 9. Cost Analysis (%).
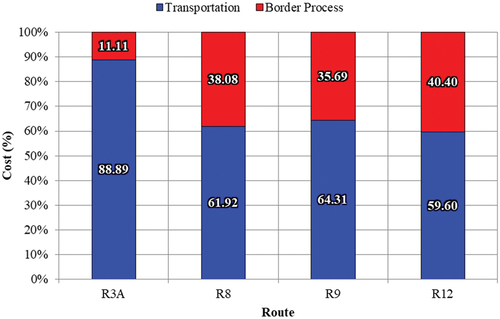
Figure 10. Time-Distance Analysis.
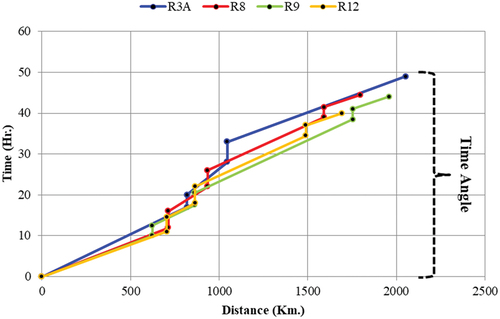
Figure 11. Time Analysis (USD).
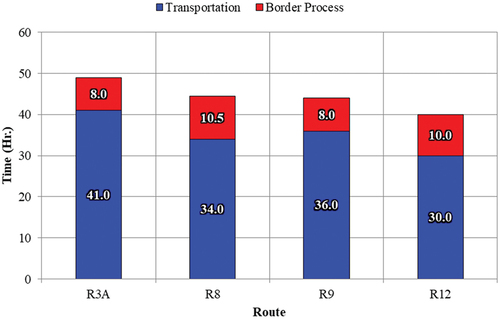
Figure 12. Time Analysis (%).
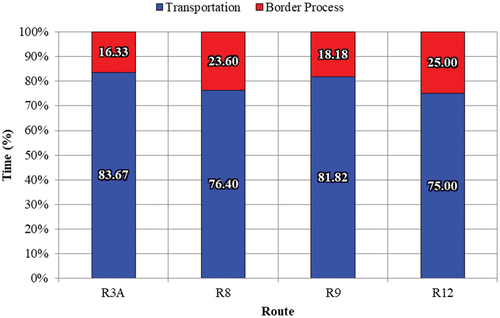
Table 10. Approximate Transport Cost and Approximate Speed of Thailand-China Routes