
Figures & data
Figure 1. The number of criminal cases in Indonesia from 2000–2020.
Note: Source: Indonesia criminal statistics (BPS, Citation2021) [Author’s work].
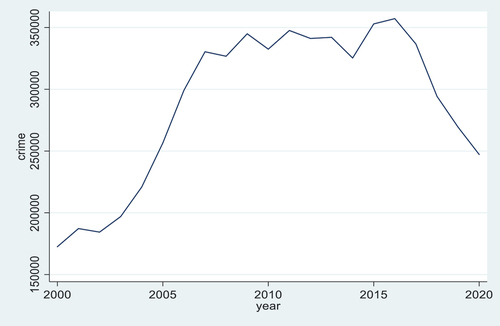
Figure 2. Indonesia’s macroeconomic development trends from 2000–2019.
Note: (a) Inequality. (b) Income per capita. (c) Inflation. (d) Unemployment.
Source: World Development Indicator (WDI, 2021) [Author’s work].
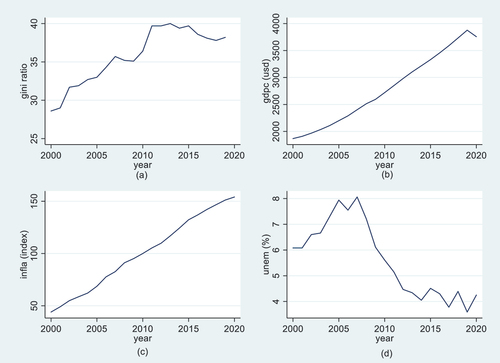
Figure 3. Frame Macroeconomics on crime.
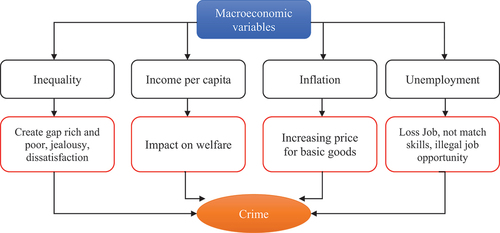
Table 1. Definition of variables used in study over the period 2000–2019
Figure 4. Framework Research.
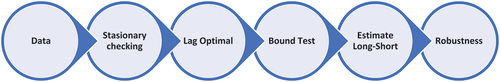
Table 2. Descriptive statistics
Table 3. Correlation matrix
Table 4. Unit Root Test
Table 5. Optimal Lag result
Table 6. Cointegration Bound Test
Table 7. Long-term and short-term estimation results
Figure 5. Cusum.
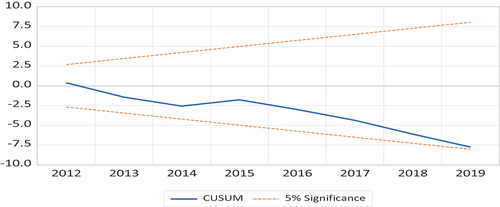
Figure 6. Cusumq.
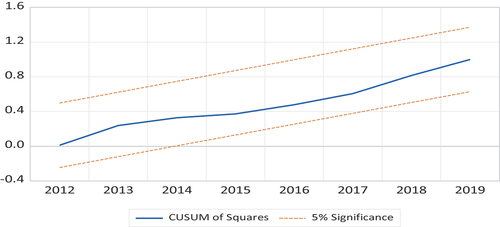
Table 8. Robustness Model (FMOLS & CCR)