Figures & data
Table 1. Descriptive statistics of the variables
Table 2. Summary statistics for categorized GII, high, medium, low and very low
Table 3. Regression models for immunization rate, anemia, crude birth rate and neonatal mortality
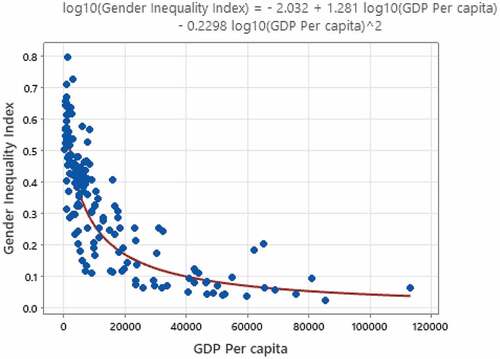
Figure 1. Association between GII and childhood immunization rate, prevalence of anemia, crude birth rate and neonatal mortality rate.
Note: SOURCE Authors’ analysis of data.
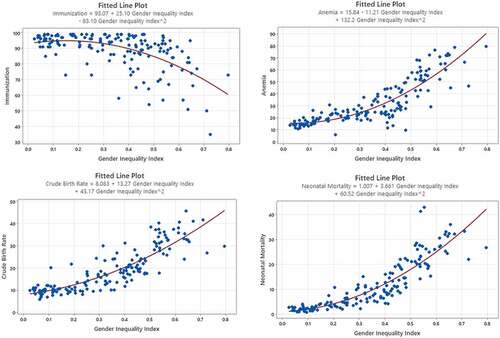
Figure 2. Association between GII and GDP per capita.
Note: SOURCE Authors’ analysis of data.