
Figures & data
Table 1. Demographics of the respondents
Figure 1. Theoretical linkage.
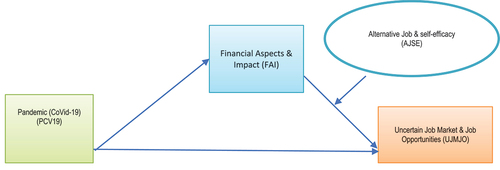
Table 2. Model fit and quality indices
Table 3. Measurement model
Table 4. Heterotrait-Monotrait ratio (HTMT)
Table 5. Coefficient of determination in the PLS method
Table 6. Path coefficient direct effect and indirect effect