
Figures & data
Figure 1. The conceptual model.
Table 1. Variables and indicators
Table 2. Characteristics of respondents
Table 3. Result of model constructs reliability and convergent validity Testing
Table 4. Fornell-Larcker criterion analysis result
Table 5. Cross loading analysis result
Table 6. Discriminant validity: heterotrait-monotrait ratio Statistics (HTMT)
Figure 2. Empirical results of the structural path model. Value on path: p-value,R2: coefficient of determination.
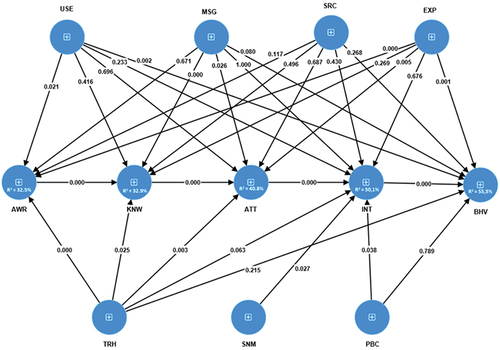
Table 7. Hypothesis and path coefficients significance Testing results