Figures & data
Figure 1. Daily tweet volume of #BLM and #SAH from 2020 to 2021.
Note. The daily tweet volume of BLM combines the total number of daily tweets with #BLM and #BlackLivesMatter.
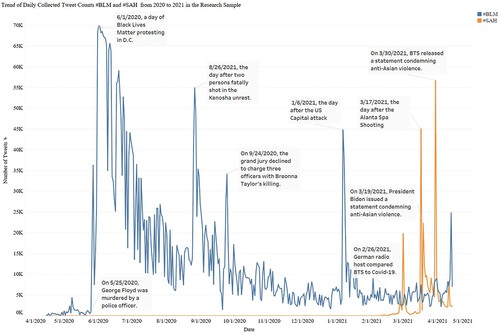
Figure 2. Trend of BTS-related tweets and SAH tweets over time.
Note. The daily tweet volume of SAH combines the total number of daily tweets with #StopAAPIHate and #StopAsianHate
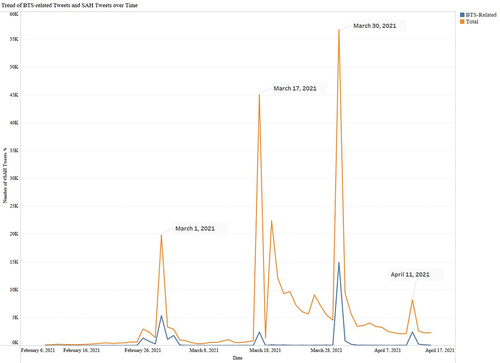
Figure 3. Entropy of #SAH and #BLM over time.
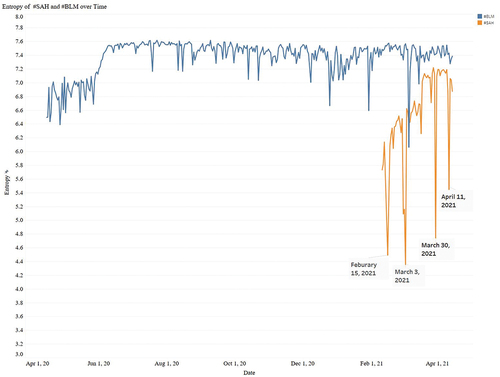
Table 1. Correlation matrix
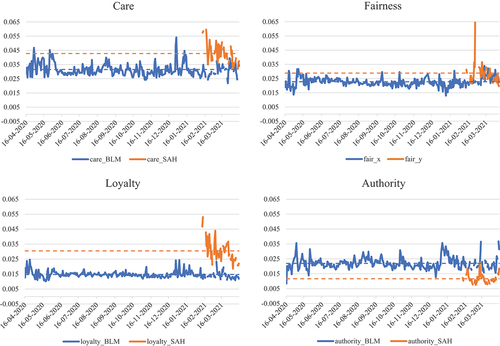
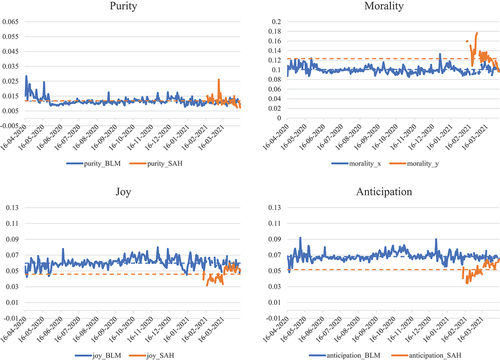
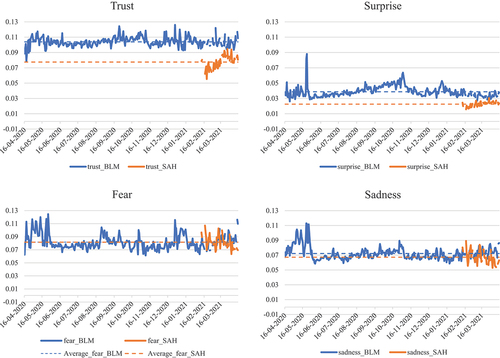
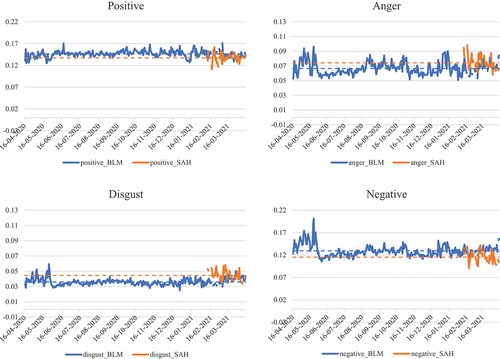
Table 2. Results of tests of between-subjects effects on emotion and moral sentiments of #BLM and #SAH
Table 3. Examples of tweets containing moral and emotional sentiments