
Figures & data
Figure 1. Resilience conceptual framework (FAO, Citation2016).
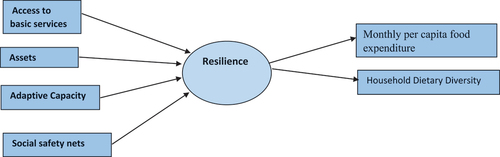
Table 1. Indicators of resilience
Table 2. RIMA domain indicators included in the study
Table 3. Mean difference between PSNP members and non-members
Figure 2. Scatter diagram showing the relationship between resilience and monthly per capita food expenditure.
Source: Own analysis from the survey data.
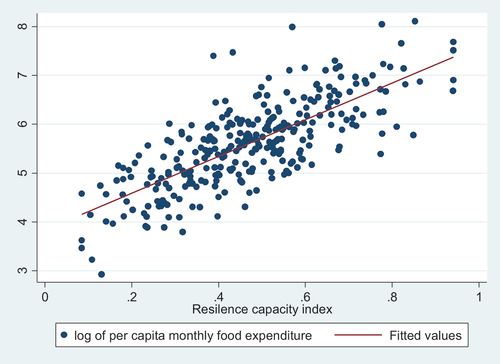
Table 4. RIMA II MIMIC determinants and indicators
Table 5. Results of the beta regression model (soruce: analysis from data set)