
Figures & data
Figure 1. Proposed model.
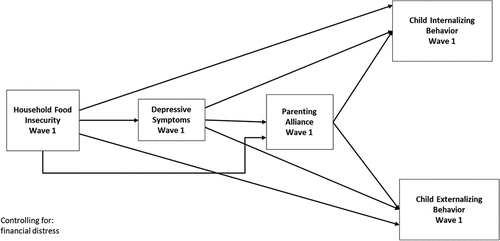
Table 1. Demographics for the total sample n = 99
Table 2. Demographics by child age: older: 6–12 years old; younger: 1 ½−5 years old
Table 3. Descriptive statistics of the study variables for the total sample n = 99
Table 4. Descriptives by child age: older: 6–12 years old (n = 46); younger: 1 ½−5 years old (n = 53)
Table 5. Pearson correlations of study variables total sample n = 99
Table 6. Pearson correlations of study variables for older group of children (above the diagonal) and younger group of children (below the diagonal)
Table 7. Path analysis of model