
Figures & data
Figure 1. PRISMA flow chart of the study on machine learning and finance.
Source: Adapted from Page et al. (Citation2021).
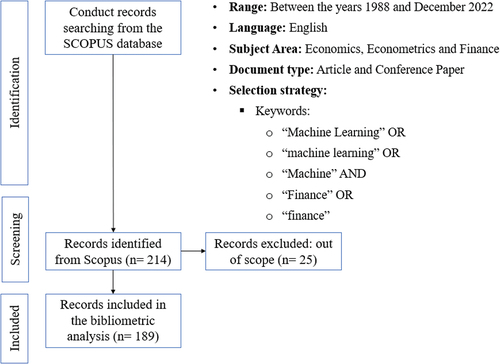
Table 1. General information
Figure 2. Document growth per year.
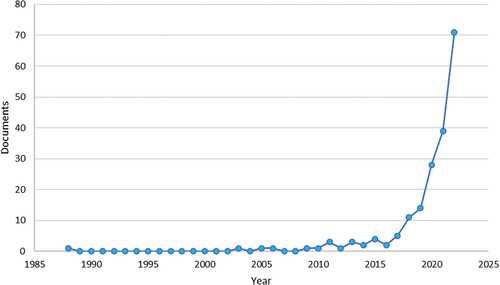
Figure 3. Most relevant countries by the corresponding author.
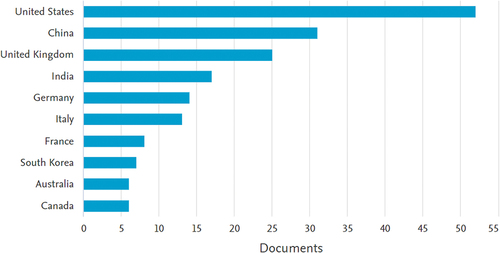
Table 2. The ten most relevant institutions
Table 3. The ten most relevant journals
Figure 4. Most relevant authors.
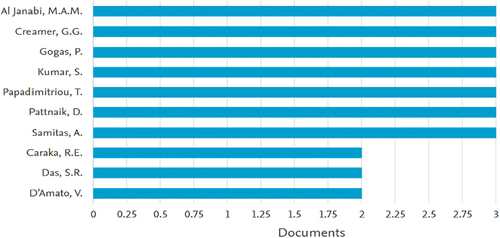
Table 4. The ten most-cited academic articles
Figure 5. Co-authorship network of key authors.
The VoSViewer software is utilised to construct the density visualisation map.
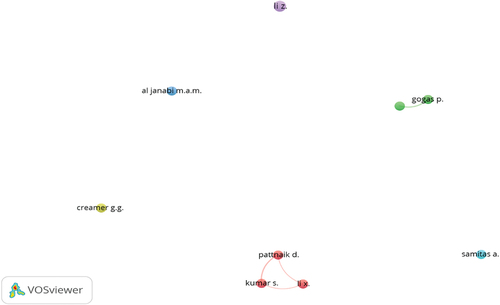
Table 5. Nine most key authors based on co-authorship analysis
Figure 6. Co-occurrence network of keywords.
The VoSViewer software is utilised to construct the density visualisation map.
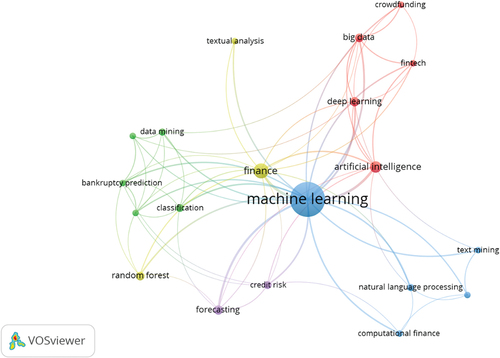
Figure 7. Keywords density visualisation map.
The VoSViewer software is utilised to construct the density visualisation map.
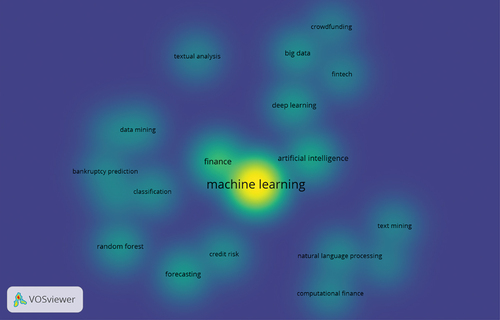
Table 6. The top 10 keywords of publications