Figures & data
Figure 2. Conceptual framework.
Note: The round dot lines show the moderating path of gender.
Source: Authors’ construct.
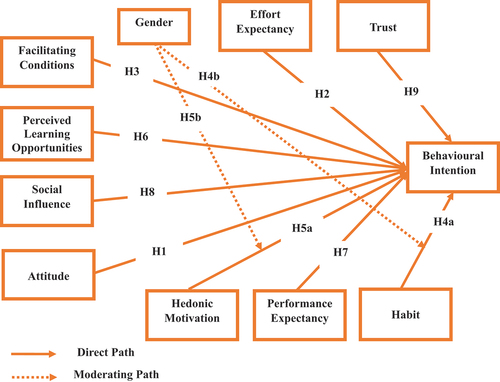
Table 1. Constructs, items, IL, CA (α), rho_A, CR and AVE
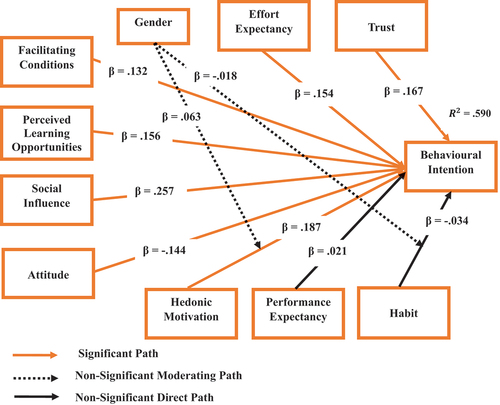
Figure 3. PLS-SEM path coefficients and item loadings.
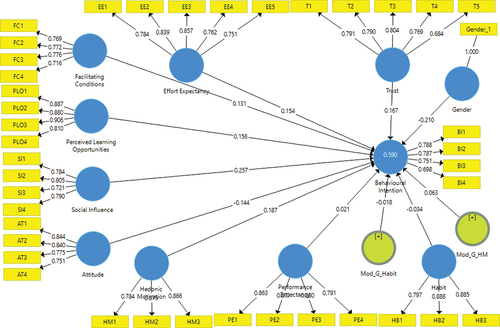
Table 2. Discriminant validity using Fornell-Larcker criterion
Table 3. Heterotrait-Monotrait (HTMT, <0.90) ratio for discriminant validity
Table 4. Multicollinearity test
Figure 4. PLS-SEM bootstrapping.
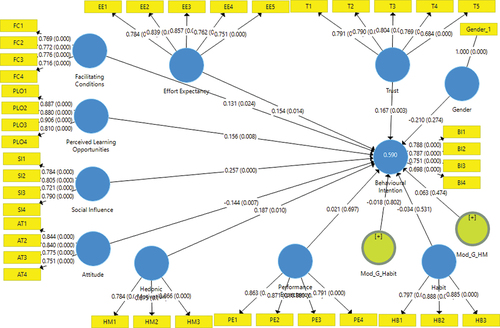
Table 5. Path coefficients and hypotheses testing
Table 6. Coefficient of determination, effect size and predictive relevance
Table 7. Moderating effect of gender
Figure 5. Importance-Performance Map.
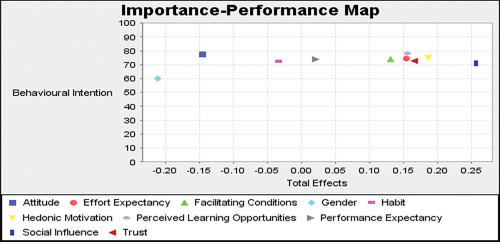
Table 8. Total effects and performance Index values for behavioural intention
Figure 6. Revised conceptual framework.
Source: Authors’ construct.