
Figures & data
Figure 1. Oil and non-oil Saudi exports.
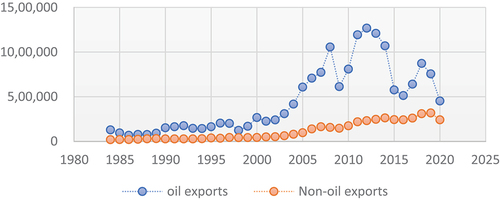
Table 1. Variables Description
Table 2. Stability test of variables
Figure 2. Scatter plot of the relationships between LNXG and LREER, LREER_NEG and LREER_POS.
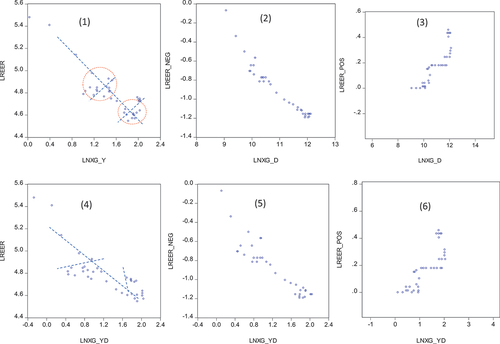
Table 3. OLS and threshold regression of equation 1 (demand function of exports)
Figure 3. CUSUM and CUSUM of squares tests of OLS regression of equations 1, table 3, Column 2.
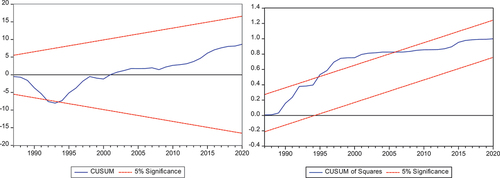
Table 4. ARDL and NARDL regression of the demand function of non-oil exports (equation 1)
Figure 4. CUSUM and CUSUM of squares tests of ARDL regression of equation 1, table 4.
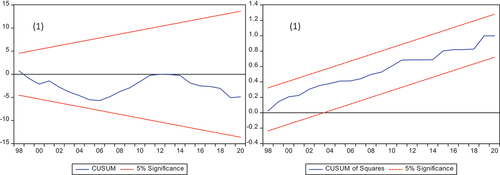
Figure 5. CUSUM and CUSUM of squares tests of NARDL regression of equation 1, table 4.
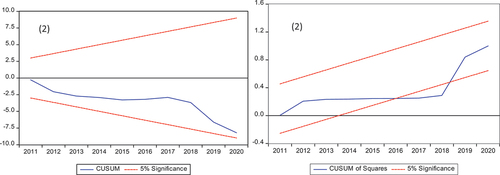
Figure 6. Asymmetric plot of NARDL regression of equation 1.
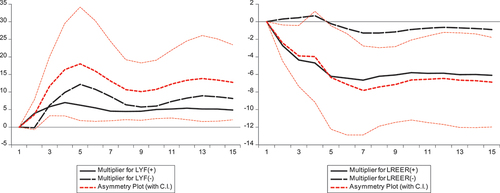
Figure 7. Relationship between LNXg_y and LXP_XPF.
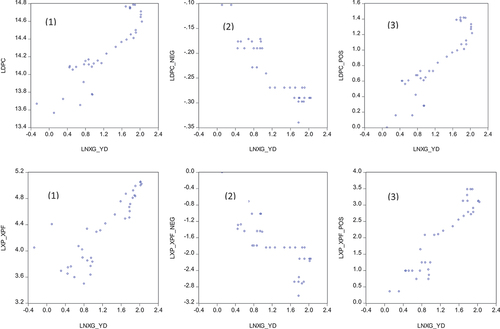
Table 5. Estimation of the supply function of non-oil exports (equation 2)
Figure 8. CUSUM and CUSUM of squares tests of ARDL regression of equation 2, table 5.
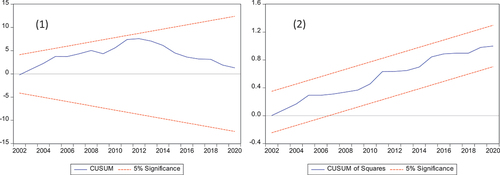
Figure 9. Scatter plots of LNXg_Y and LHIC, LINVT, LCR_Y, LGOV_Y, LIM_Y, OPNX.
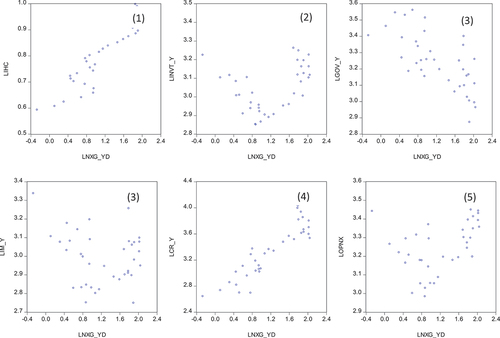
Figure 10. CUSUM and CUSUM of squares tests of ARDL regression of equation 3, Column 1, table 6.
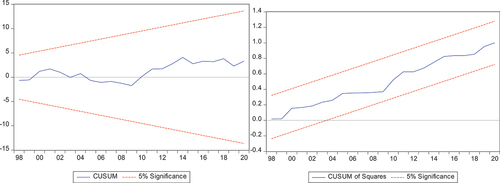
Figure 11. CUSUM and CUSUM of squares tests of ARDL regression of equation 3, Column 2, table 6.
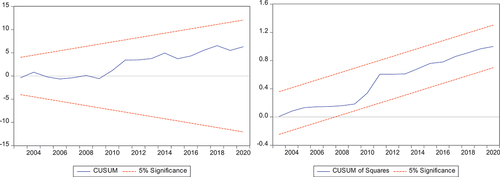
Figure 12. CUSUM and CUSUM of squares tests of ARDL regression of equation 3, table 7.
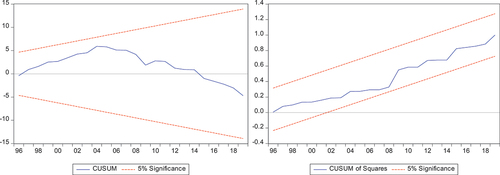
Table 6. ARDL estimating the supply function of non-oil exports in equation 3
Table 7. ARDL estimation of the supply function of non-oil exports in equation 3 with LINV and LIHC