
Figures & data
Figure 1. Livelihood frame work depicting interplay between environment and community.
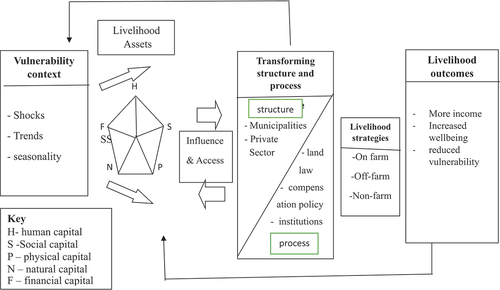
Figure 2. Map of the study areas.
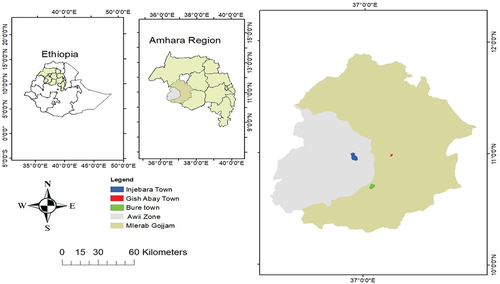
Table 1. Distribution of sample households by municipalities
Table 2. Summary of Definition of explanatory variables of MNL model
Table 3. Livelihood diversification strategies of peri urban households
Figure 3. Choices of the livelihood diversification strategy adopted by the sampled household.
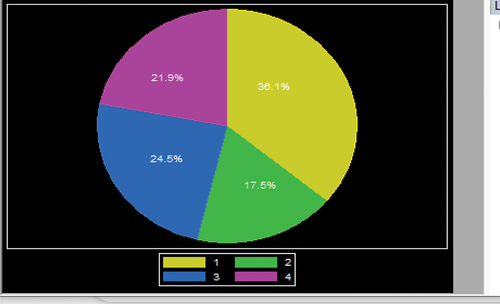
Table 4. ANNOVA test result of continuous variables
Table 5. Summary of statistics for continuous explanatory variables by choice of livelihood strategies
Table 6. Descriptive results for dummy explanatory variables by choice of livelihood strategies
Table 7. Multinomial logit model result on determinants of livelihood diversification strategies