Figures & data
Figure 1. Processes involved in acquiring a permit to site a filling station in Ghana (Damnyag & Aazagreyir, Citation2020).
Figure 2. Map of Wa Municipality.
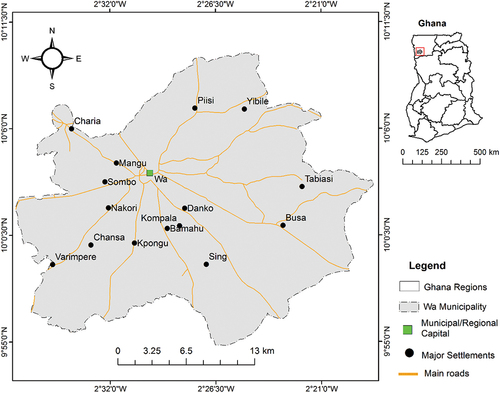
Table 1. Profile of filling stations in the Wa Municipality
Figure 3. Spatial distribution of filling stations in the Wa Municipality.
0 = Total 1; 1 = Grid; 2 = Excel 1; 3 = Jusbro; 4 = Galaxy Oil; Frimps = 5; 6 = Enazif Gas; 7 = Petrosol 6; 8 = Total 2; 9 = Joekana Gas; 10 = Goil 1;11 = Total3; 12 = AP; 13 = Link Gas; 14 = Petrosol 1; 15 = Press Gas; 16 = Goil 2; 17 = Goil 3; 18 = Total 4; 19 = Goil 4; 20 = Petrosol 2; 21 = Goil 5; 22 = Total 5; 23 = Goil 6; 24 = Star Oil; 25 = Excel 2; 26 = Petrosol 3; 27 = Biyad Gas; 28 = Shell; 29 = Petrosol 4; 30 = Goil 8; 31 = Goil Gas; 32 = Petrosol 5;
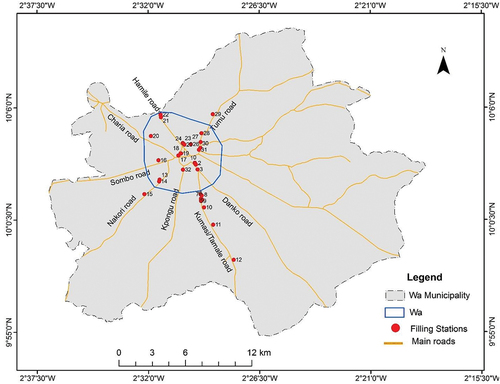
Figure 4. Nearest neighbor statistics of filling stations distribution.
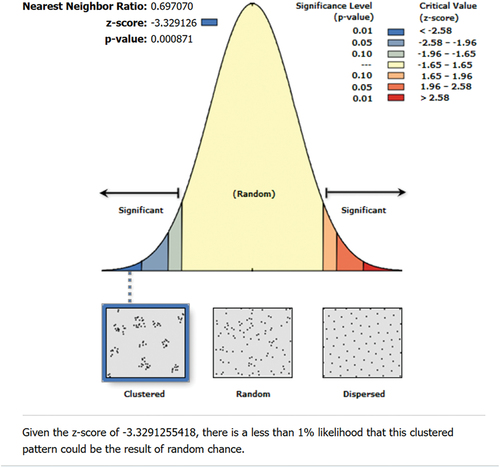
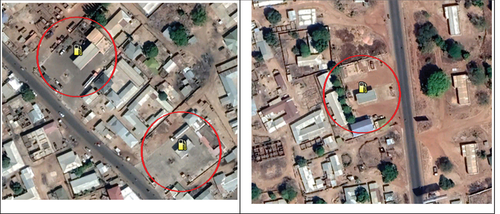
Figure 5. Aerial view of some filling stations showing residential properties within the GNFS 50m fire safety zone.
Red circle = 50 m buffer around filling station; Yellow fuel gauge = filling station
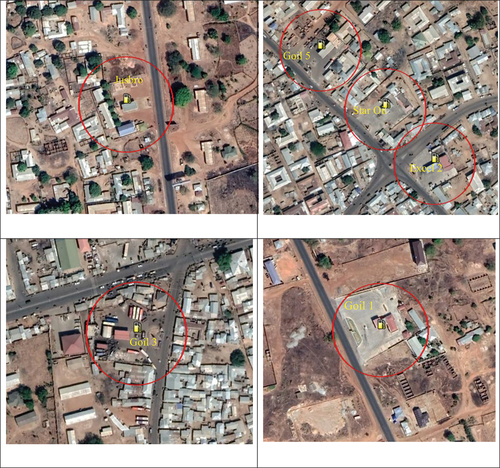
Table 2. Number of residential properties within the safety zones of filling stations
Figure 6. Aerial view of filling stations showing residential properties within the GNPA 30.8m health buffer zone.
Red circle = 30 m buffer around filling station; Yellow fuel gauge = filling station