
Figures & data
Table 1. Descriptive statistics.
Table 2. Skewness test.
Figure 1. Daily growth rate of infected persons () vs. population size of the city (
).
Prior to vaccination ()
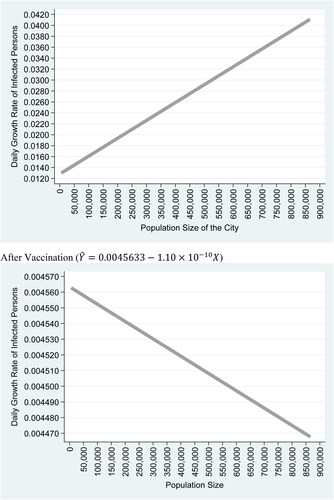
Figure 2. List of settlements above 52,000 persons and their population size.
Source: Google map. The settlements are arranged from north to south. The Population size reflects the number of persons at the settlement. Only settlements with a population above 52,000 persons are included.
*Settlements that appear on the map.
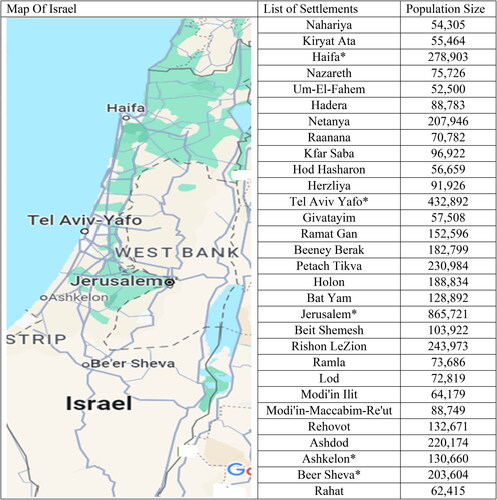
Table 3. Regression analysis and covariates weights.
Figure 3. Relative contributions of explanatory variables.
Notes: The figure describes the relative contribution of each variable to the daily infection rate from COVID-19, namely, projected STD increase of the dependent variable–the daily infection growth rate, following a one standard deviation increase in each independent variable in absolute value (;
;
;
). The Figure is based on the outcomes obtained from column (3) in .
where
is the average and
is the standard deviation of
.
![Figure 3. Relative contributions of explanatory variables.Notes: The figure describes the relative contribution of each variable to the daily infection rate from COVID-19, namely, projected STD increase of the dependent variable–the daily infection growth rate, following a one standard deviation increase in each independent variable in absolute value (−Z[dum_vaccine×t]; Z(PopulationSize); Z[MedianAge]; [−Z(RANK2013)]). The Figure is based on the outcomes obtained from column (3) in Table 2. Z(Xi)=Xi−X¯σX where X¯ is the average and σX is the standard deviation of Xi.](/cms/asset/cea69a79-18d2-4d27-bc16-37b021f331cb/oass_a_2299136_f0003_b.jpg)
Table 4. Dickey–Fuller unit root tests for panel data.
Table 5. Cross validate.
Table 6. Spatial autocorrelation.
Table
Table
Table 7. Regression with interacted variables.
Table 8. Robustness test: regression analysis and covariates weights.
Supplemental Material
Download Zip (9.3 MB)Availability of data and materials
This research is based on information downloaded from the Israeli Ministry of Health website. After publication, supplementary materials which permit replications of the outcomes in Stata version 16.1 software package will be provided.