
Figures & data
Figure 1. Imports value for the selected EAC countries in USD million (March 2020–December 2022). Source: Central Bank of Kenya (CBK), National Bank of Rwanda (NBR), and Bank of Uganda (BOU) Statistical Databases. Notes: The value of imports is measured in USD million.
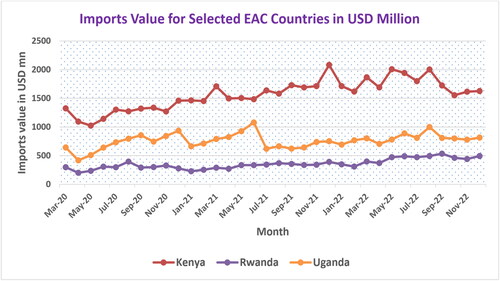
Figure 2. Exports value for the selected EAC countries in USD million (March 2020–December 2022). Source: CBK, NBR, and BOU Statistical Databases. Notes: The value of exports is measured in USD million.
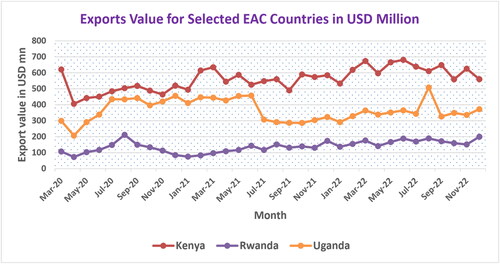
Figure 3. Trade deficit for the selected EAC countries in USD million (March 2020–December 2022). Source: CBK, NBR, and BOU Statistical Databases. Notes: The values shown in depict a negative trade balance (trade deficit).
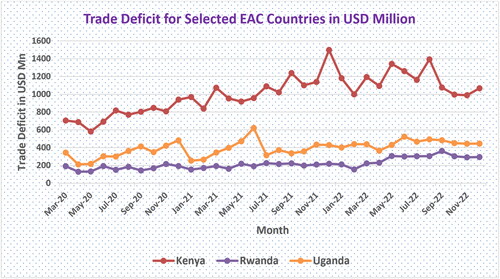
Table 1. Summary statistics of study variables.
Table 2. Panel unit root test results.
Table 3. Full pooled mean group model regression results-trade deficit estimates.
Table 4. Full pooled mean group model regression results-import estimates.
Table 5. Full pooled mean group model regression results-export estimates.
Table A1. Different summary statistics per panel.
Table A2. Correlation matrix.
Table A3. Pedroni cointegration test results.
Data availability statement
The data used for this study and the supporting Stata analyses do-files can be made available upon reasonable request from the author. The data is freely and readily accessible and was sourced from the country-specific Central Banks, the National Bureau of Statistics, Ministries of Health, and OPEC databases.