
Figures & data
Figure 1. Mean coffee export in millions of kilograms in the period 2000 and 2021.
Source: Author Computation using Data From FAO, 2022.
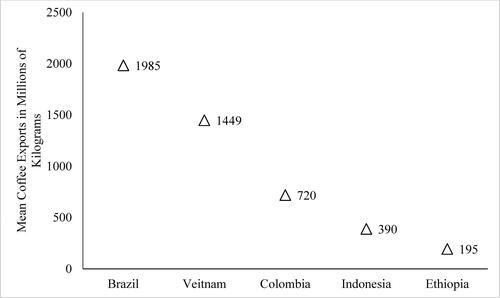
Figure 2. Mean sesame export in millions of kilograms between 2000 and 2021.
Source: Author Computation using Data from FAO, 2022.
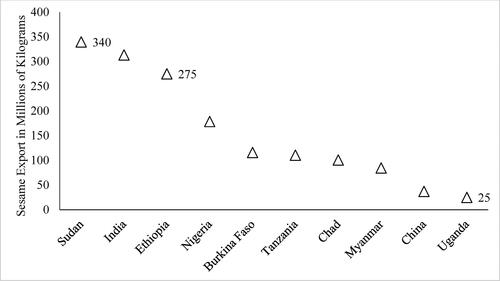
Table 1. Mean percentage composition of Ethiopian major exports in the period 2010–2021.
Figure 3. Values of sesame, coffee, and total exports of Ethiopia for the period 2010–2021.
Source: Author Computation using Data from NBE, 2023.
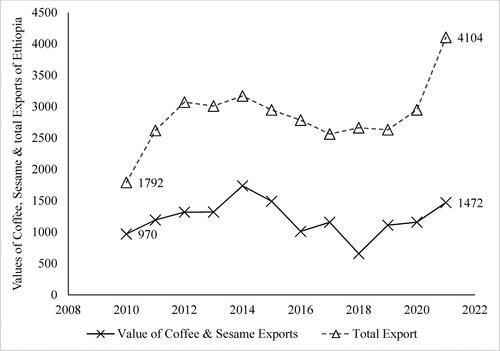
Figure 4. Trend of Ethiopian export and import values for the period 2010–2021.
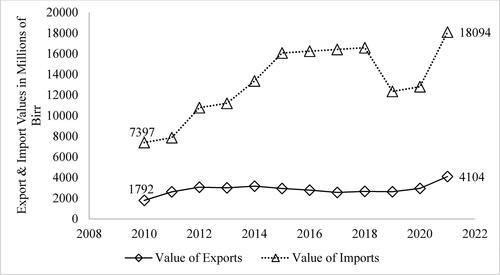
Figure 5. Mean share of Ethiopian exports by destinations for the period 2015–2021.
Source: Author Computation, 2023.
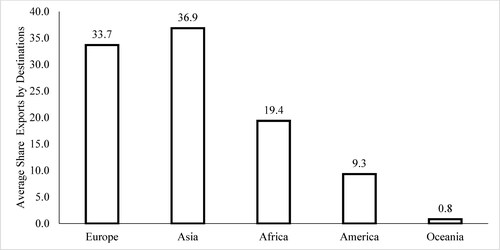
Table 2. Mean exports of Ethiopian coffee and sesame to major trade partners in 2010–2021.
Table 3. The Harris-Tzavalis unit root test results for all variables in the model.
Table 4. Regression results of the system generalized moment method.