
Figures & data
Table 1. Correlation coefficients.
Figure 1. Size of middle class in largest economies in different income categories.
ARG: Argentina, AUS: Australia, BRA: Brazil, CAN: Canada, CHL: China, COL: Colombia, DEU: Germany, ESP: Spain, ETH: Ethiopia, FRA: France, GBR: Great Britain, GHA: Ghana, IDN: Indonesia, IND: India, IRN: Iran, ITA: Italy, KAZ: Kazakhstan, MEX: Mexico, MYSL Malaysia, NGA: Nigeria, PAK: Pakistan, PHL: Philippines, POL: Poland, RUS: Russia, THA: Thailand, TUR: Turkey, UGA: Ugands, USA: Uganda, USA: United States, UZB: UZBEkistan, ZAF: South Africa.
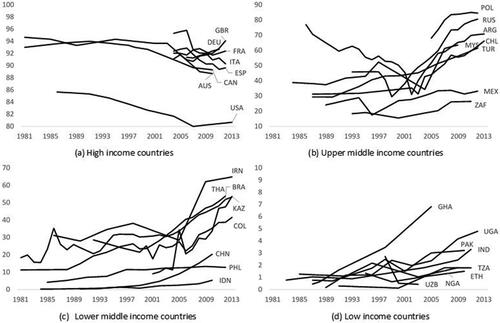
Figure 2. US net national income per capita and share of class quintiles.
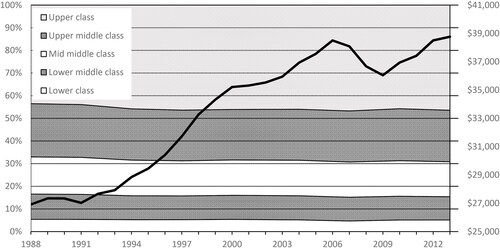
Table 2. Impact of trade liberalization on average class incomes.
Table 3. Impact of political and economic freedoms on average class incomes.
Figure 3. Impact of freedoms for varying levels of development.
L: Lower-income countries; LM: Lower middle-income countries; UM: Upper middle-income countries; H: High-income countries.
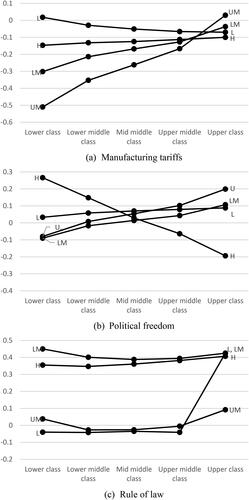
Figure 4. Impact of freedoms for varying levels of development – continued.
L: Lower-income countries; LM: Lower middle-income countries; UM: Upper middle-income countries; H: High-income countries.
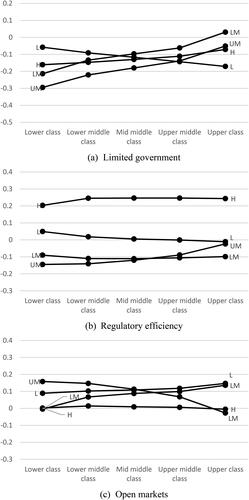
Table 4. Impact of freedoms on average class incomes for varying levels of development.
Data availability statement
The data that support the findings of this study are available from the following resources available in the public domain: The World Bank’s micro household survey: https://www.worldbank.org/en/programs/lsms. The World Bank Poverty and Equity Database: https://datacatalog.worldbank.org/dataset/poverty-and-equity-database. UN Comtrade database: https://comtrade.un.org/. Political freedom from the Freedom House: https://freedomhouse.org/. Economic freedom from the Heritage Foundation: https://www.heritage.org/index/