
Figures & data
Table 1. Total violence and percentage in Selangor, Kuala Lumpur, and Putrajaya in 2015–2020.
Figure 1. Police stations boundary for Selangor and Kuala Lumpur Contingent Headquarters.
Source: Data Collection/Analysis Division, Crime Prevention and Community Safety Department (CPCSD), Royal Malaysian Police Headquarters (RMP), Bukit Aman.
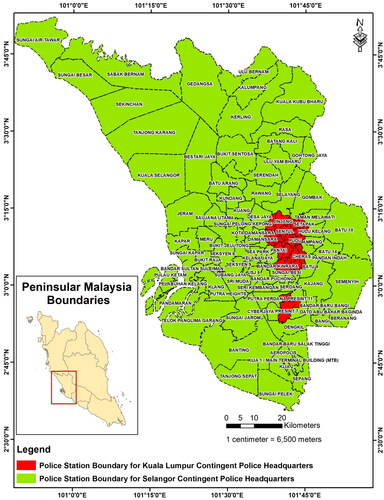
Figure 2. Landuse 2018 for the Selangor, KLFT and PFT areas.
Source: MyGDI program [Malaysia Geospatial Data Infrastructure].
![Figure 2. Landuse 2018 for the Selangor, KLFT and PFT areas.Source: MyGDI program [Malaysia Geospatial Data Infrastructure].](/cms/asset/c7290ae9-11bd-45a9-b6d1-3c7b39d155f1/oass_a_2347411_f0002_c.jpg)
Figure 3. Methodology flowchart.
Source: Ahmad et al., Citation2024a.
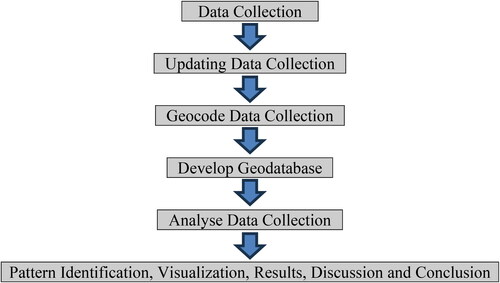
Figure 4. Radar graph of the percentage of violence crime incidents in a 24-hour period.
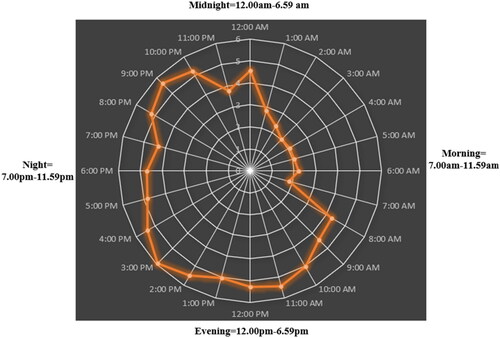
Table 2. Time frame classification of violence crimes 2015–2020.
Table 3. The highest z-score hot spot for midnight, morning, evening and night from the year 2015 until 2020.
Figure 5. Relationship between hot spot percentage and police boundary.
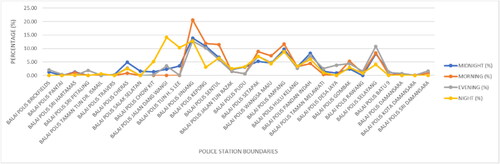
Table 4. Percentage of police station boundaries and hot spots for violence crimes 2015–2020 for four frame time categories.
Figure 6. Violence crime hot spot locations based on station boundaries according to four time frame categories (Midnight, 12 a.m.–6.59 a.m.).
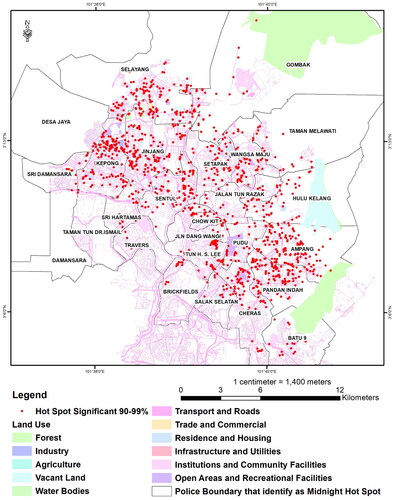
Table 5. Percentage of land use type and hotspot for property crime 2015–2020 for four time frame categories.
Figure 7. Violence crime hot spot locations based on station boundaries according to four time frame categories (Morning, 7 a.m.–11.59 a.m.).
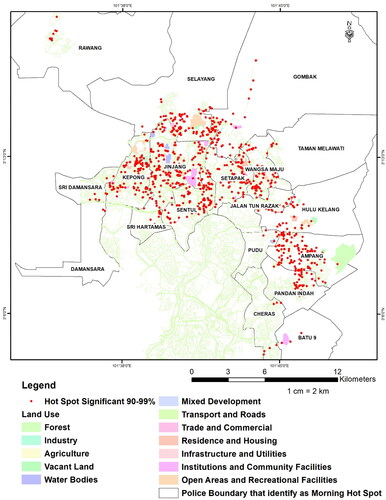
Figure 8. Violence crime hot spot locations based on station boundaries according to four time frame categories (Evening, 12 p.m.–6.59 p.m.).
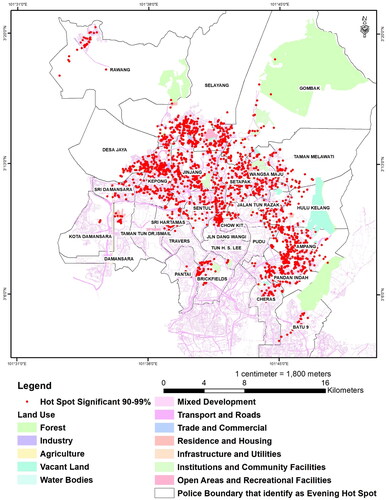
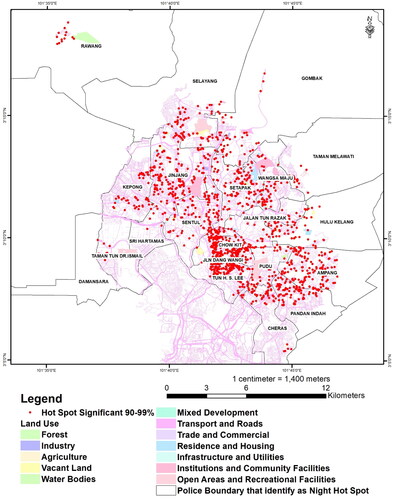
Figure 9. Violence crime hot spot locations based on station boundaries according to four time (Night, 7:00 p.m.–11:59 p.m.).
Data availability statement
Data available on request due to privacy/ethical restrictions.
The data is confidential of Government of Malaysia under Royal Malaysian Police (RMP).