
Figures & data
Figure 1. Number of departments by field.
Source: Higher Education Database at https://pddikti.kemdikbud.go.id/
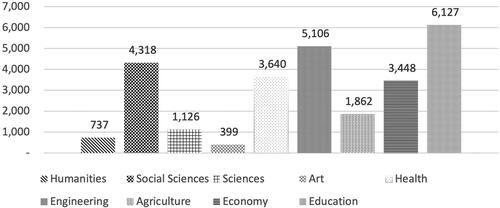
Table 1. Differences between State GHE and IHE in Indonesia.
Figure 2. Research process.
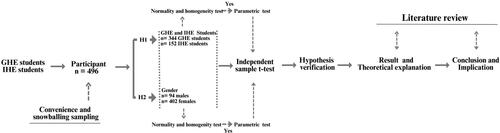
Table 2. Normality and homogeneity test.
Table 3. Reasons for choosing a university.
Figure 3. Comparison of factors for choosing a university.
Note. Results of data processing using SPSS V. 26.
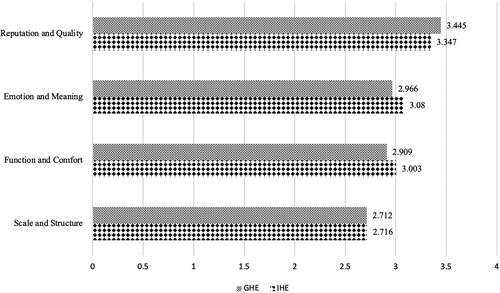
Table 4. Independent sample t-test results in factors of choosing a university.
Table 5. Clusters of university students.
Table 6. Gender-related choice factor.
Data availability statement
The data that support the findings of this study are available from the corresponding author, Ahmad Juhaidi, upon reasonable request.