
Figures & data
Figure 1. Number of tweets created during 1st–31st March 2021.
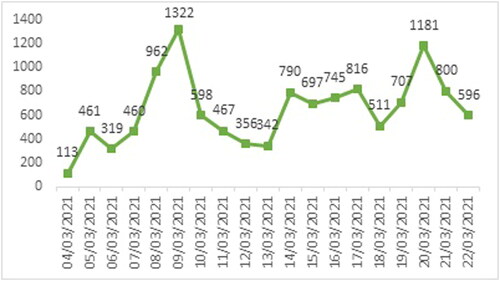
Figure 2. Top 10 user locations from the collected tweets.
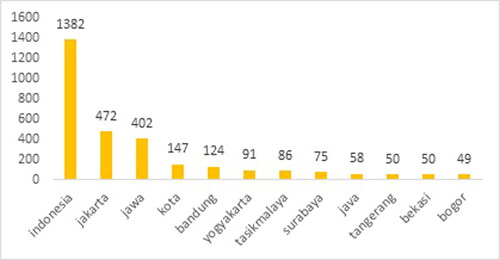
Figure 3. The user location (Java or Outside Java).
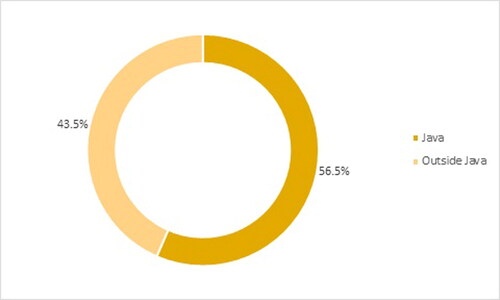
Figure 4. The result of word-level sentiment analysis.
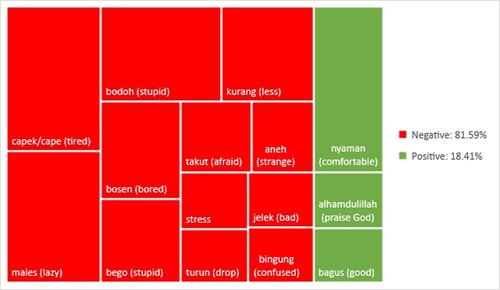
Figure 5. The frequency of each word with sentimental tendency appeared from the collected tweets.
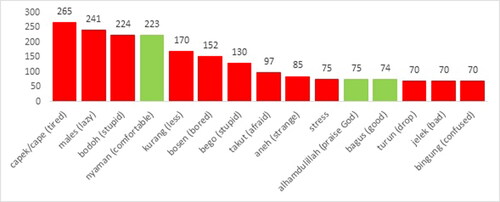
Table 1. The English translation for the words appeared on the sentiment analysis.
Table 2. Four other most frequently occurring words with an interesting combination.
Data availability statement
Data and materials are available upon reasonable request.