
Figures & data
Table 1. Descriptive statistics (N = 17,322)
Table 2. Mean and standard deviation of the four scale scores at each time point (N = 17,322)
Table 3. Model comparison statistics for latent class analysis
Table 4. Growth factor estimates for each latent class
Figure 1. Model implied growth trajectories across three latent class
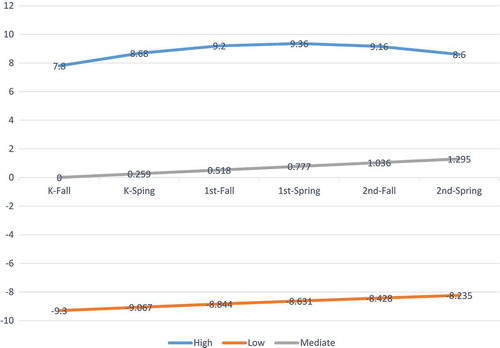
Table 5. Estimates from multinomial logistic regression
Appendix 1. Variable names, data source, original coding, and recoding rules
Appendix 2. Reliability of four measures for the overall self-control