
Figures & data
Table 1. Definition of terms in hypnosis treatment
Figure 1. PRISMA flow chart.
The PRISMA guidelines include a flowchart outlining the criteria for the identification, selection, eligibility, and inclusion of articles covered by the review. Finally, 12 studies were considered in this review.
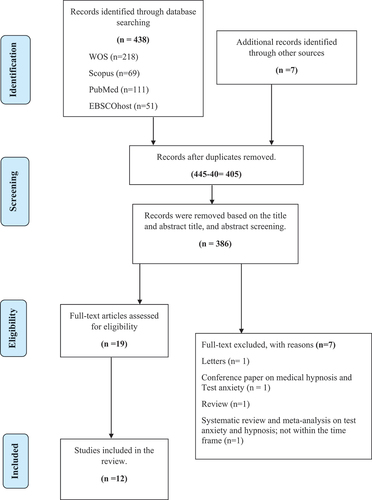
Table 2. Summary of key characteristics of all included articles
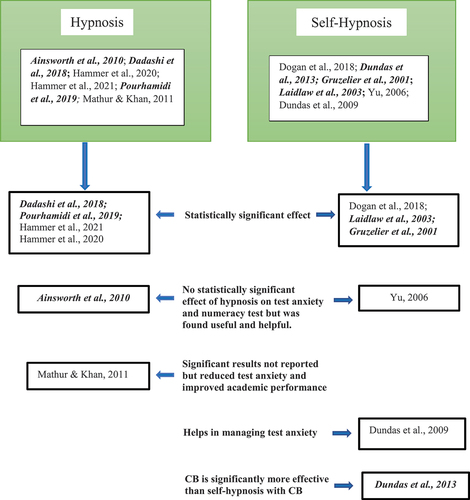
Figure 2. Comparison between hypnosis and self-hypnosis studies’.
The chart shows that six studies used hypnosis and six studies used self-hypnosis interventions to reduce Test anxiety. The grouping was based on the study’s findings.
Supplemental material
Supplementary Materials.docx
Download MS Word (79.1 KB)Data availability statement
The authors confirm that the data supporting the findings of this study are available in the article and its supplementary materials (Appendices A, B and C).