Figures & data
Figure 1. A schematic of the material testing system set-up.
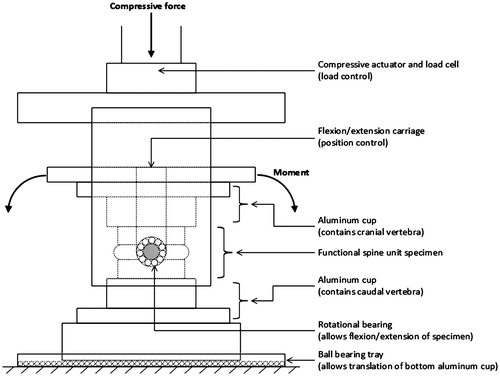
Figure 2. Images of a specimen in the material testing system: specimen in flexion (left) and extension (right). The moment angle data were sampled from an independent servomotor connected in series with a torque cell.
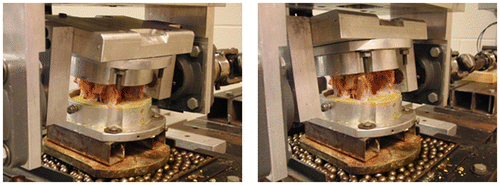
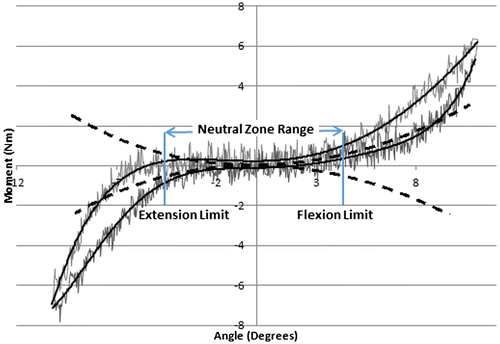
Figure 3. Defining neutral zone range using a method of fitting a fourth-order polynomial curve to the ascending and descending curve (solid line) to the raw data (thin line), and first derivative of the fitted curve (dotted line) was calculated (Thompson et al., Citation2003). The neutral zone range was defined by the angle where it reached ± 0.05 Nm/degree (flexion and extension limit defined).