Figures & data
Figure 1. The National Highway N-5.
Source: NHA
Figure 2. Schematic plan of the research study.
Table 1. Vehicle classes and allowed maximum load
Figure 3. A view of heavy vehicles, WIM Recording Station.
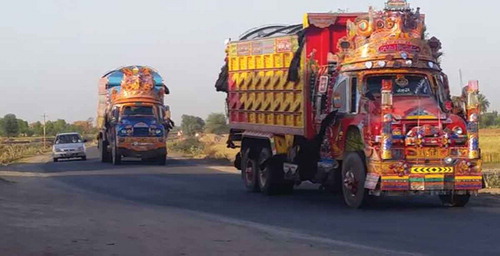
Figure 4. Number and type of vehicles observed on the WIM station during the data collection period.
Table 2. Percentage of overloading based on legal and observed GVW
Figure 5. Percentage of average to maximum load for each axle of different classes of vehicles.
Figure 6. Comparison of legal GVW with maximum and average observed GVW.
Figure 7. Percentage of overloaded vehicles in WIM data.
Table 3. Axle parameter (AP) Pais et al. (Citation2013)
Figure 8. Variation of truck factor with axle configuration and various loading conditions.
Figure 9. Variation of truck factor with asphalt layer thickness for legal axle loads.
Figure 10. Variation of truck factor with subgrade modulus for legal axle loads.