Figures & data
Table 1. Chemical composition of cement and silica fume
Figure 1. Particle size distribution of the fine aggregates.
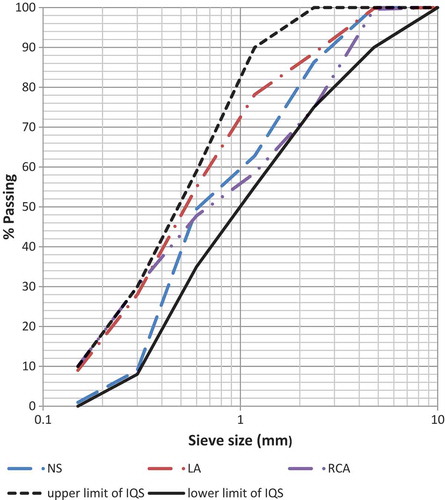
Table 2. Mix proportions of mortars (kg/m3)
Figure 2. Effect of aggregate type and w/b ratio on the 7- and 28-day compressive strength of the mortars.
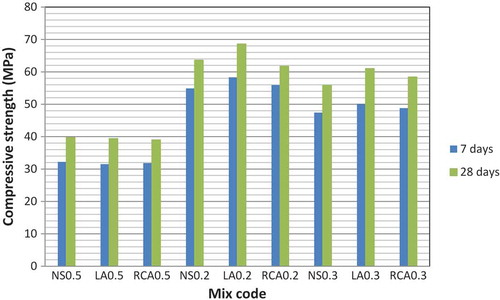
Figure 3. Effect of aggregate type and w/b ratio on the 7- and 28-day flexural strength of the mortars.
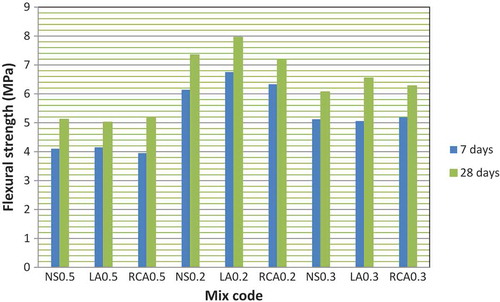
Figure 4. Drying shrinkage with age for mortars produced with (a) w/b = 0.5, (b) w/b = 0.2, and (c) w/b = 0.3.
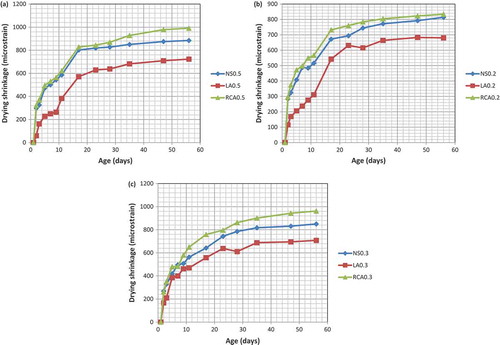
Figure 5. Effect of w/b ratio on drying shrinkage of mortars at 56 days.
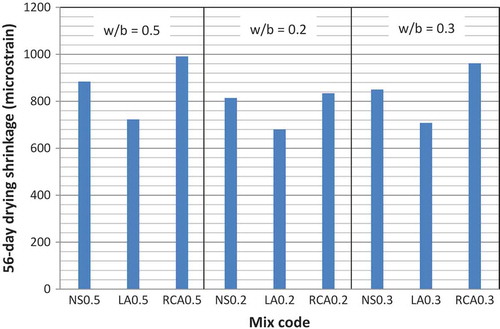
Figure 6. Autogenous shrinkage with age for mortars prepared with (a) w/b = 0.5, (b) w/b = 0.2, and (c) w/b = 0.3.
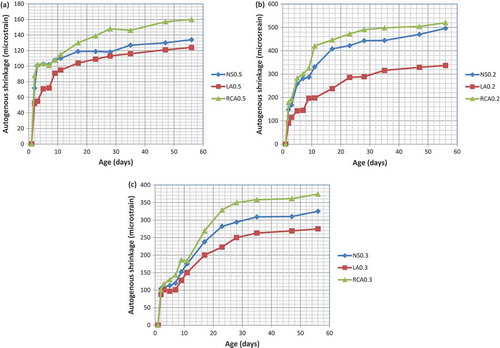
Figure 7. Effect of w/b ratio on autogenous shrinkage of mortars at 56 days.
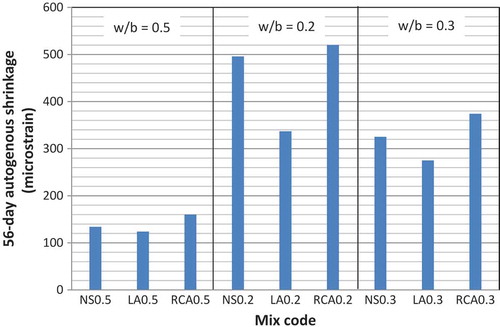
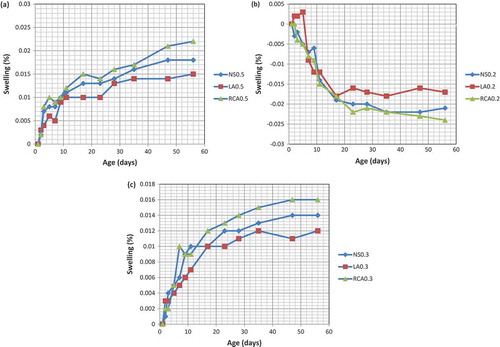
Figure 8. Swelling versus age for mortars produced with (a) w/b = 0.5, (b) w/b = 0.2, and (c) w/b = 0.3.