Figures & data
Figure 1. Tr(R2) Statistics for p = 3 with: a), b)
, c)
, and d)
Table 1. List of kernel function (Härdle & Linton, Citation1994)
Table 2. Control limit of the proposed chart with and
for p = 3 to 10 for in-control ARL 370
Table 3. Control limit of the proposed chart with and
for p = 11 to 30 for in-control ARL 370
Table 4. ARLs of the proposed chart with ,
and n = 10 for various number of quality characteristics p
Table 5. ARLs of the proposed chart with ,
and n = 20 for various number of quality characteristics p
Table 6. ARLs of the proposed chart with ,
and n = 30 for various number of quality characteristics p
Table 7. ARLs of the proposed chart with ,
and n = 50 for various number of quality characteristics p
Table 8. ARLs of the proposed chart with ,
and n = 100 for various number of quality characteristics p
Figure 2. ARLs of Proposed chart with p = 3 for various n.
Table 9. ARLs of the proposed chart with ,
,
and n = 10 for various number of quality characteristics p
Table 10. ARLs of the proposed chart with ,
,
and n = 10 for various number of quality characteristics p
Table 11. ARLs of the proposed chart with ,
,
and n = 10 for various number of quality characteristics p
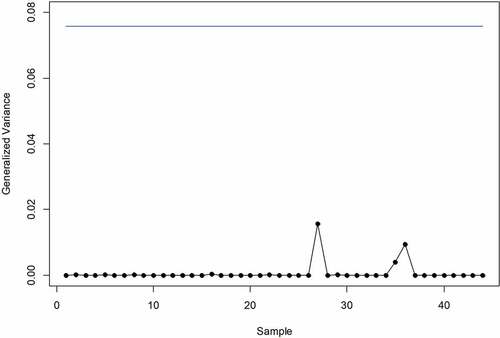
Figure 3. Monitoring ZA fertilizer production dataset using Tr(R2) control chart
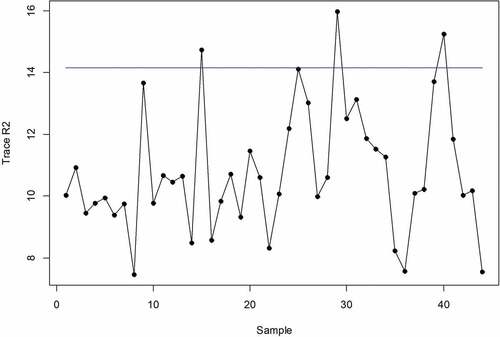
Figure 4. Monitoring ZA fertilizer production dataset using conventional GV control chart