Figures & data
Figure 1. Location and cross-section of the metro line 3 and sewer tunnel
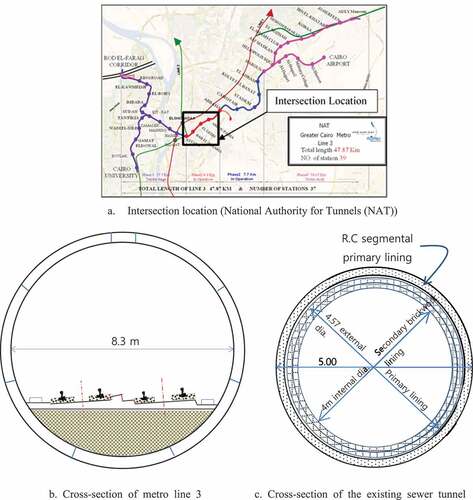
Figure 2. Crossing layout of metro line 3 tunnel and the existing Sewer tunnel
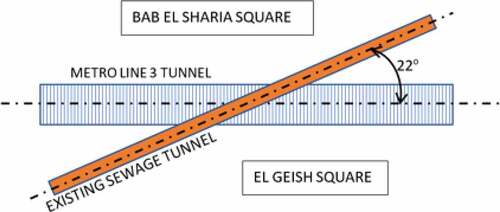
Table 1. Sewer tunnel description at the crossing location
Table 2. Slurry parameters for the used shield machine
Table 3. TBM working parameters
Table 4. Soil design parameters at tunnel crossing
Figure 3. Soil treatment underneath the sewer tunnel area at the intersection location
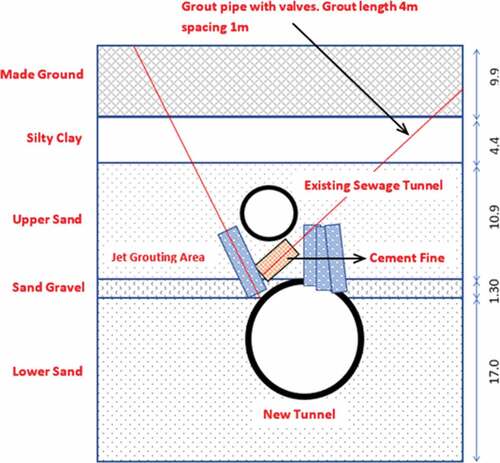
Figure 4. 3D Model dimension of soil and the two crossing tunnels
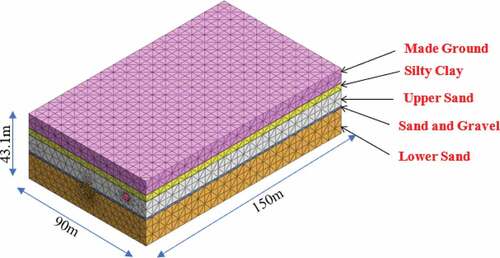
Table 5. Material properties of concrete, shield & grout
Figure 5. Simulation of analytical stages of tunnelling by mixed shield machine
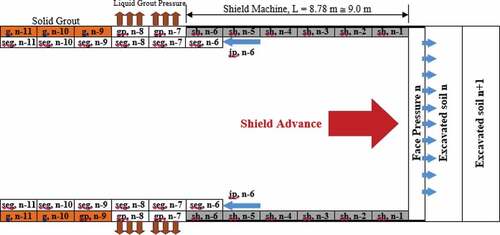
Figure 6. Simulation of shield excavation stages for the numerical model
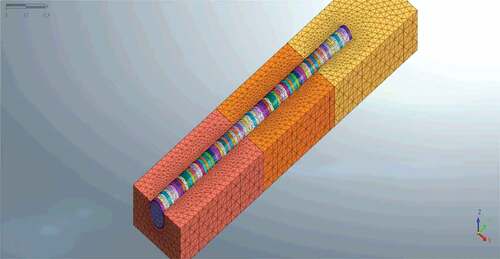
Figure 7. Comparison between model results and measured data for vertical deformation
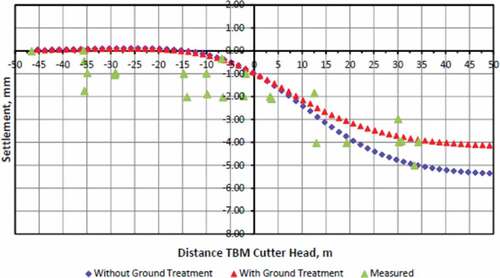
Figure 8. Comparison between model results and measured data for transversal deformation
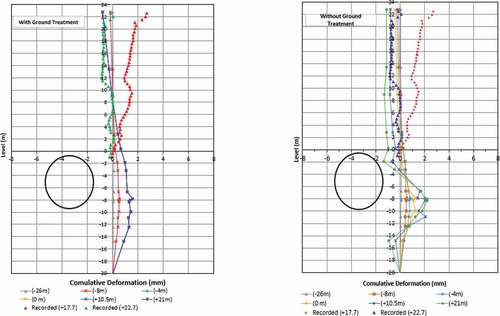
Figure 9. Settlements at the crossing points of two crossing tunnels at different angles
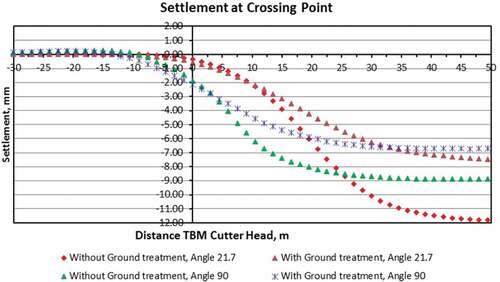
Figure 10. The relation between the crossing angle and maximum settlement at the crossing point
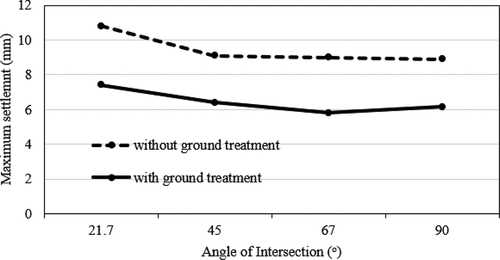
Table 6. The maximum settlement at the crossing point for various crossing angles, φ
Figure 11. The vertical clearance, C between the two crossed tunnels (C is related to the existing tunnel; 1.5D = 7.5 m)
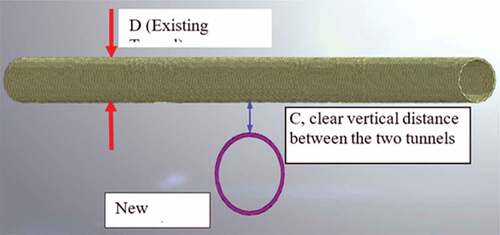
Figure 12. The maximum settlements at the crossing point of the two crossing tunnels at different clearance distances
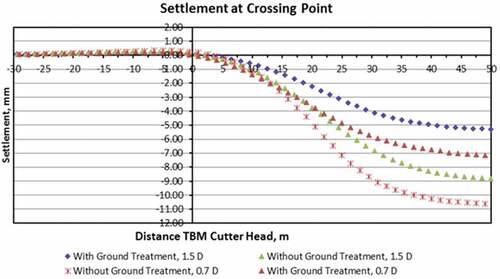
Figure 13. Variation of principal stresses (σ1, σ2, σ2) in the existing tunnel lining
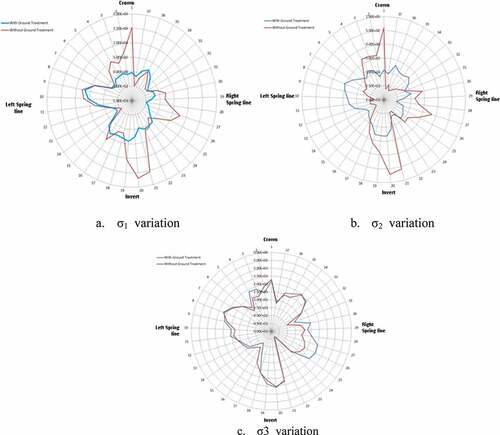
Figure 14. Von-Mises stresses in the existing tunnel lining
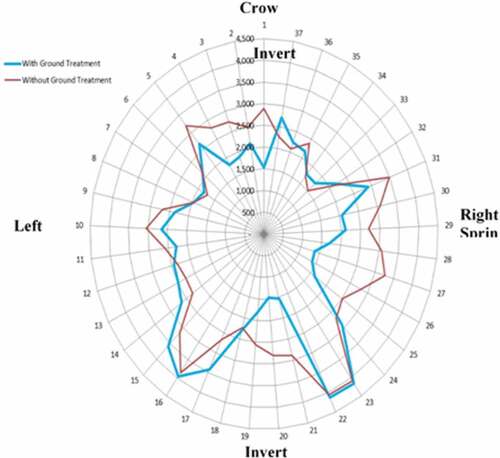
Figure 15. Settlements at the crossing points with different characteristics of treated soil
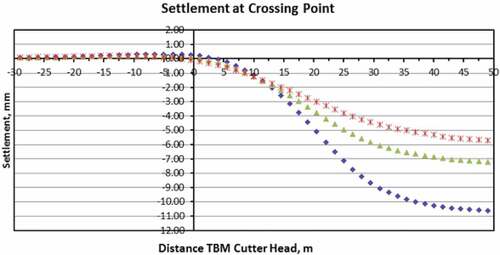
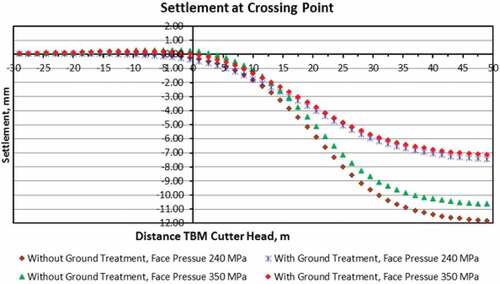
Figure 16. Settlements at the crossing point at different face pressures with and without soil treatment