
Figures & data
Figure 1. The treatment mechanism for (a) Titanate treated mechanism illustrating three sites of reaction. (b) Silane-treated illustrating one site of reaction
Table 1. Mean flexural strength (MPa), standard deviation, minimum and maximum values
Table 2. Mean Vickers hardness number (kg/mm2), deviation, minimum and maximum values
Figure 2. Surface morphology of dentures reinforced by; a- 5wt. % and; b- 7wt. % of salinized nano ZrO2 filler (Safi & Moudhaffar, Citation2011)
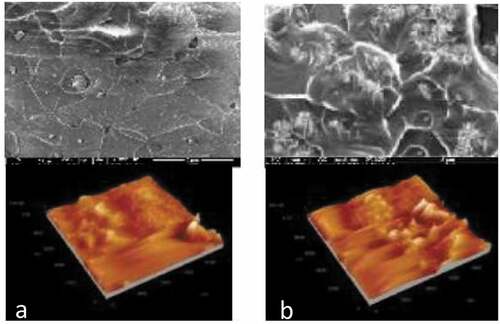
Table 3. The summary of ZrO2 additive fillers and its effect on denture base acrylic resin
Table 4. Viable cell counts of Candida albicans, Lactobacillus acidophilus and Streptococcus mutans biofilms in non-UV activated resin and following activation with UV irradiation in a conventional denture base acrylic resin (Naji, Behroozibakhsh et al., 2018)
Table 5. The summary of TiO2 additive fillers and its effect on denture base acrylic resin
Figure 3. Mean and standard deviation of the growth of Candida albicans in each experimental group (Safi & Moudhaffar, Citation2011)
Figure 4. Mean flexural strength values with standard deviations (Elshereksi, Mohamed et al., Citation2014)
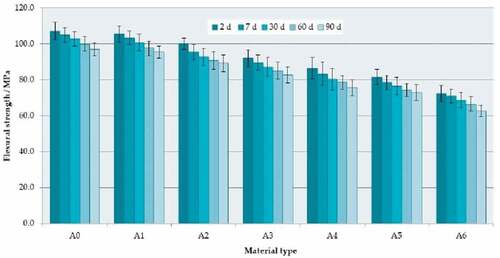
Figure 5. Scanning electron microscope (A) PMMA without nanoparticles, (B) PMMA with nanoparticle aggregations (Kamonkhantikul et al., Citation2017)
Figure 6. The mean values of mechanical characteristics for the control group and 1.5 % SWCNTS (Ibrahim, Citation2015)
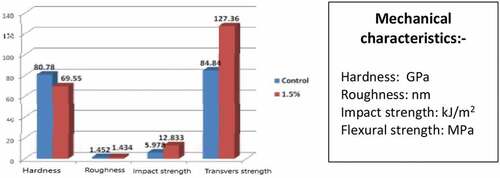
Table 6. The summary of Nano carbon additive fillers and its effect on denture base acrylic resin
Figure 7. (A) AFM shows average surface roughness of different groups of samples compared to 5wt. % of ZrO2 and control sample; (B) Comparison of the average surface roughness of the same group indicated in the field (A) (Nagao et al., Citation2011)
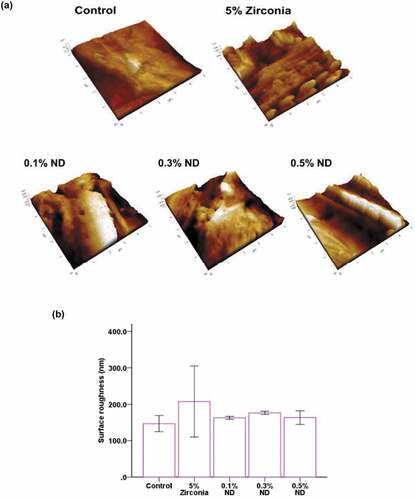
Table 7. The summary of HA additive fillers and its effect on denture base acrylic resin
Figure 8. Differences between the control group composite and other groups of 0.05% Au and 0.2%Au composites (Da Silva et al., Citation2012)
Table 8. Hybrid reinforcement added materials