
Figures & data
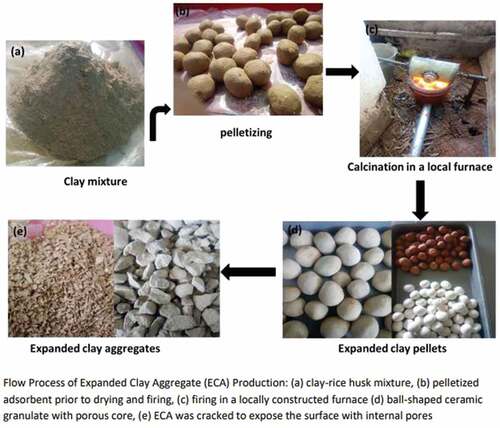
Table 1. Review of the usage of Expanded Clay Aggregate in Water Purification
Table 2. Mixture Design and Description
Figure 1. Flow Process of Expanded Clay Production: (a) clay-rice husk mixture, (b) pelletized adsorbent prior to drying and firing, (c) firing in a locally constructed furnace (d) ball-shaped ceramic granulate with porous core, (e) ECA was cracked to expose the surface with internal pores
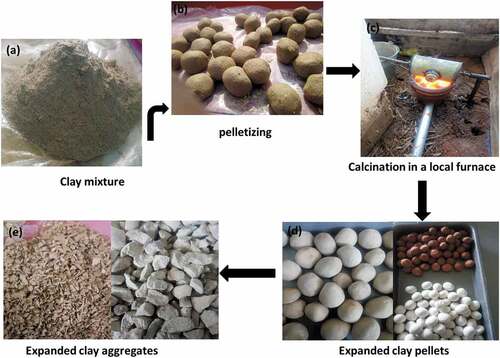
Figure 2. Surface image of ECA particle under a scanning electron microscope (SEM) showing cavities; (a) GI-1 exposes the stack sheet structure of kaolin; (b) GI-2; stack sheet morphology (c) GI-3—showing long, slender and fibrous aggregate of sillimanite and hexagonal flakes; (d) GI-4—mixed surfaces of sheet platelets and hexagonal flakes; (e) GI-5—mixed surfaces of sheet platelets and hexagonal flakes; (f) GI-6—multi-porous well defined flakes; (g) GI-7 multi-porous well defined flakes with more connected pores-; (h) GI-8—possess long, slender and fibrous aggregates of sillimanite with more pores than GI-3
Table 3. Surface area/pore analysis of the ECAs
Figure 3. XRD plots of ECA at 1100°C and 1200°C showing mineralogy. (a) 100% Kutigi clay; (b) 100% Minna; (c) 40% Kutigi+40% Minna + 20% rice husk; (d) 85% Kutigi + 15% rice husk
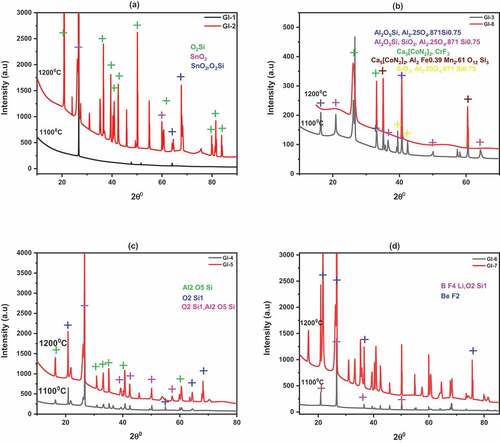
Table 4. Physical Parameters of sterile water after soaking ECA adsorbents in it for 24 hours
Figure 4. The antibacterial efficiency of ECA adsorbent on E. Coli bacteria before filtration at 105 CFU/ml raw water and after filtration. The adsorbents have excellent reusability as they maintained high disinfection efficiency after 6 recycling
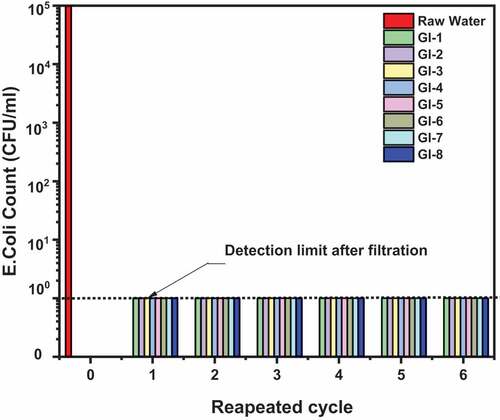
Figure 5. Phosphate and Nitrate reduction efficiencies; (a) phosphate concentration reduction for adsorbents calcined to 1100°C: GI-1 > GI-6 > GI-3 > GI-4; (b) Phosphate concentration reduction for adsorbents calcined to 1200°C: GI-2 > GI-7 > GI-8 > GI-5; (c) Nitrate concentration reduction for adsorbents calcined to 1100°C: GI-1 > GI-3 > GI-4 > GI-6; (d) Nitrate concentration reduction for adsorbents calcined to 1200°C: GI-2 > GI-5 > GI-8 > GI-7
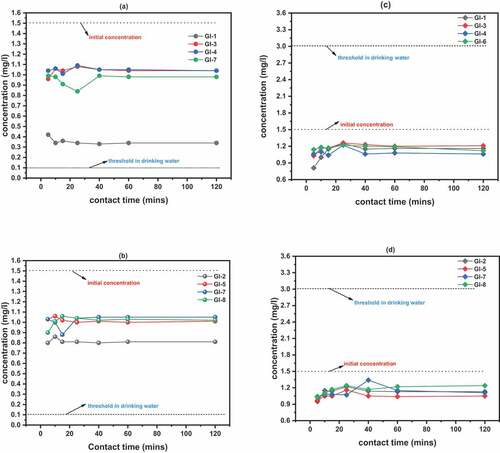
Figure 6. Adsorption of Pb (II) and As (III) on ECA, 25°C and pH 5.0 (a, c) Langmuir adsorption isotherms for Pb and As respectively; (b, d) Freundlich adsorption isotherms for Pb and As respectively: (e, f) Adsorption kinetics for Pb and As respectively
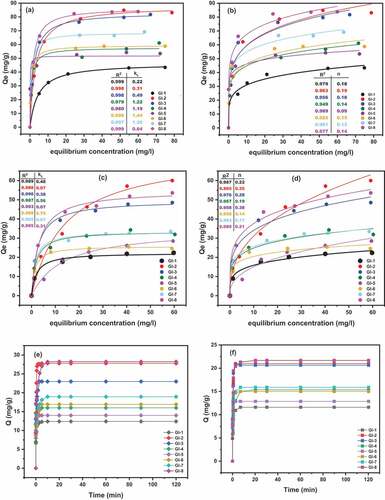
Figure 7. Effect of pH on adsorption; (a) Pb II; (b) As III. Experimental conditions: temperature 27 °C, contact time 40 min, adsorbent dose 0.1 g/100 ml
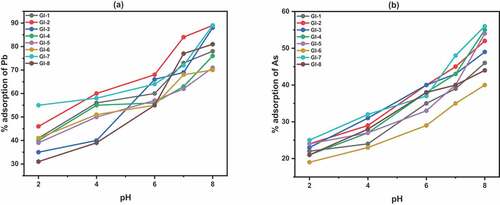
Figure 8. Effect of adsorbent dose on adsorption of Pb II and As III. Experimental conditions: temperature 27 °C; contact time 40 min; pH 6; (a) adsorbents are calcined to 1100°C; (b) adsorbents are calcined to 1200°C
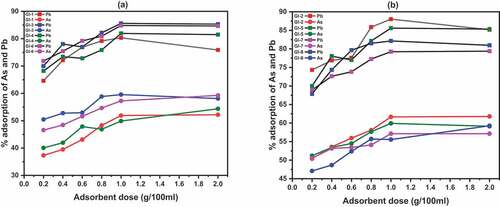
Figure 9. Cyclic experiments for the Pb (II) adsorption shaken for 30 minutes at 25°C regenerated with 0.01 M Na2 EDTA
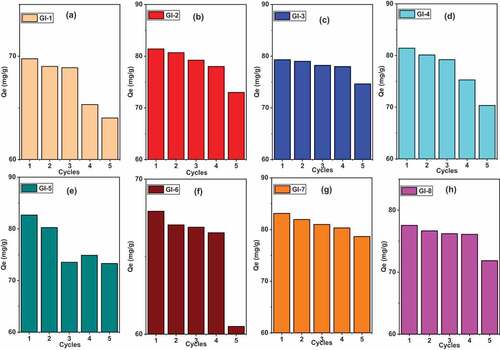
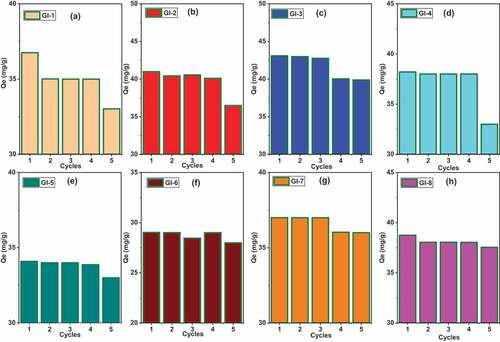
Figure 10. Cyclic adsorption experiments for As (III) shaken for 30 minutes at 25°C regenerated with 0.1 M NaOH
Data Availability Statement
The data that support the findings of this study are available from the corresponding author, G.O. Ihekweme, upon reasonable request https://repository.aust.edu.ng//xmlui/gina ihekweme.