
Figures & data
Figure 1. The candidate HP memristor-based chaotic circuit (Wang, Sun, Jin, Mo, Song, Dong et al., Citation2018a)
Figure 2. I1(t) v.s. t
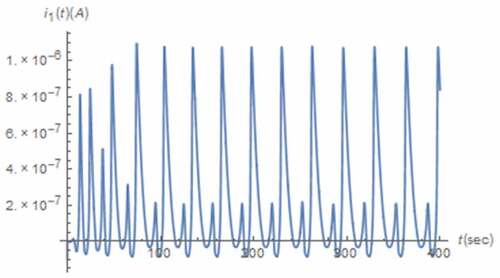
Figure 3. I2(t) v.s. t
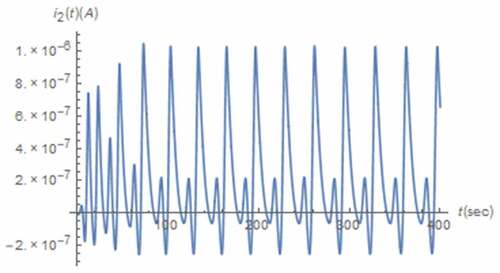
Figure 4. X(t) v.s. t
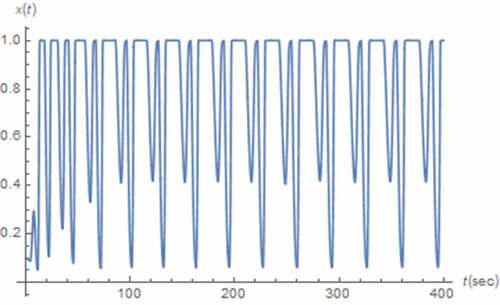
Figure 5. V1(t) v.s t
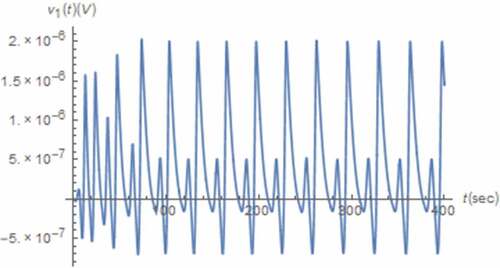
Figure 6. I1(t) v.s. v1(t)
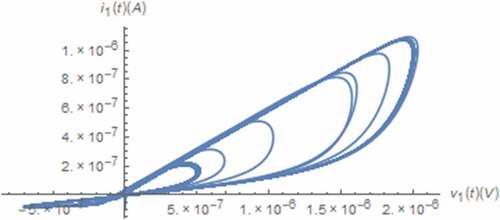
Figure 7. I2(t) v.s. v1(t)
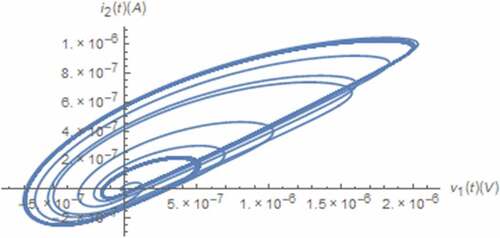
Figure 8. I1(t) v.s. x(t)
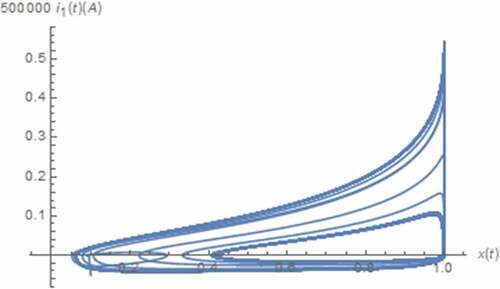
Figure 9. I2(t) v.s. x(t)
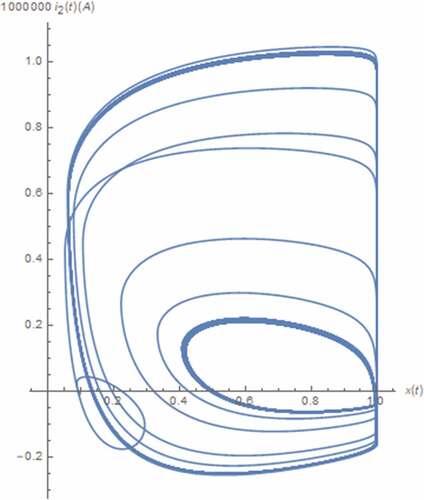
Figure 10. I2(t) v.s. i1(t)
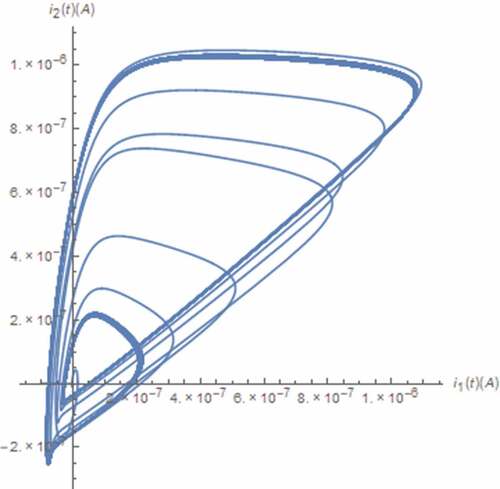
Figure 11. V1(t) v.s. x(t)
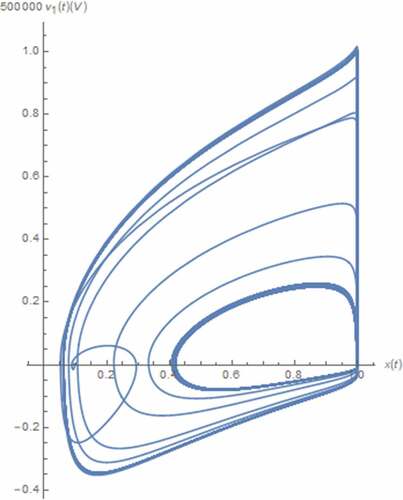
Table 1. LE1, LE2, LE3, LE4 and DL of the generalized circuit with dimensional consistency awareness
Figure 12. v.s. α.
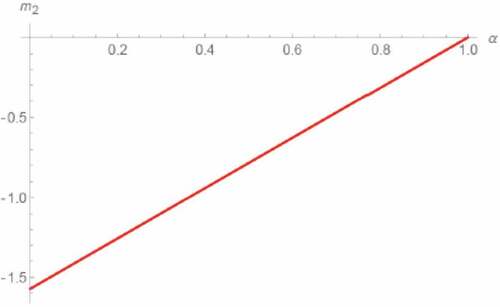
Figure 13. v.s. α.
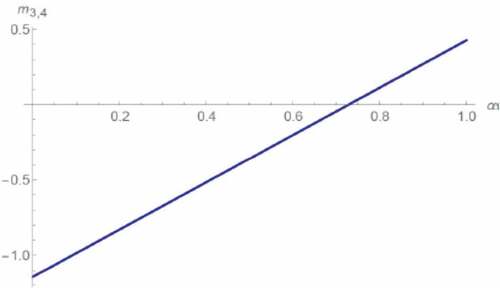
Figure 14. I2(t) v.s. x(t): α = 0.5
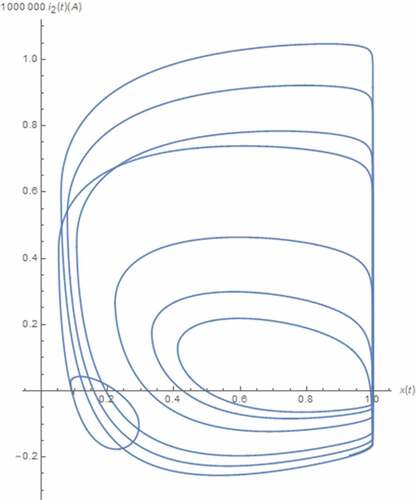
Table 2. LE1, LE2, LE3, LE4 and DL of the generalized circuit without dimensional consistency awareness
Figure 15. The emulator block diagram
Figure 16. The emulator circuit
Figure 17. The RC approximated circuit of a CPE (Petrzela, Citation2019)
Table 3. The parameter values of emulator circuit
Table 4. The resistance and capacitance values for approximating Cα
Table 5. The resistance and capacitance values for approximating Cβ
Table 6. The resistance and capacitance values for approximating Cγ
Table 7. The resistance and capacitance values for approximating Cδ
Figure 18. X(t) v.s. t
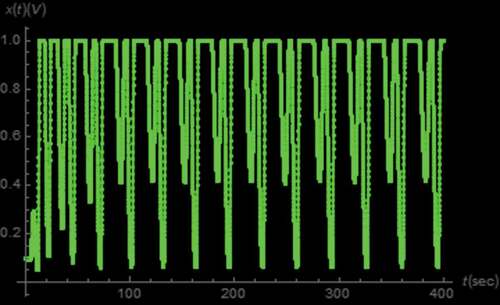
Figure 19. Y(t) v.s. t
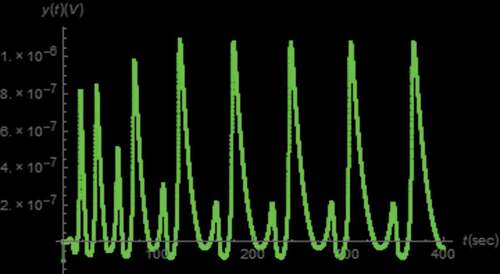
Figure 20. Z(t) v.s. t
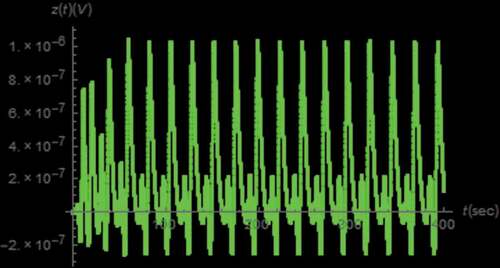
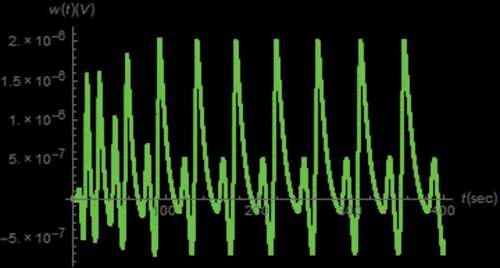
Figure 21. W(t) v.s. t
Data availability statement
The data supporting the finding of this study are available within the article.