
Figures & data
Figure 1. The natural hip joint (right hip). (a) Capsule removed anterior aspect, (b) showing the ligament (Chethan, Shyamasunder Bhat et al., Citation2018; Mattei et al., Citation2011).
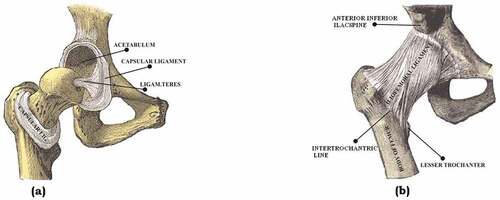
Figure 2. (a) Anterior view (Putz & Pabst, Citation2006).
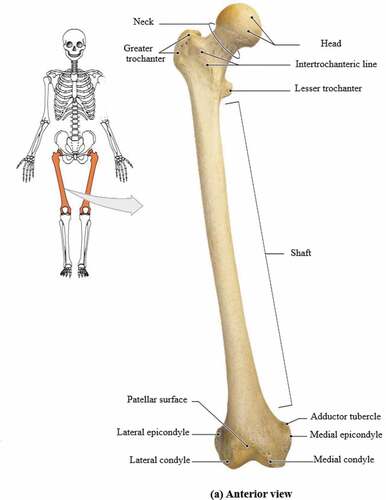
Figure 3. The shaft of the femur (Gray, Citation1960).
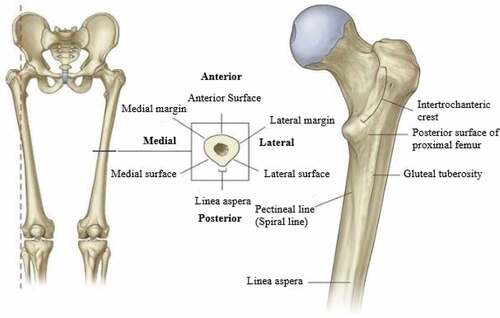
Figure 4. Acetabulum (Gray, Citation1960).
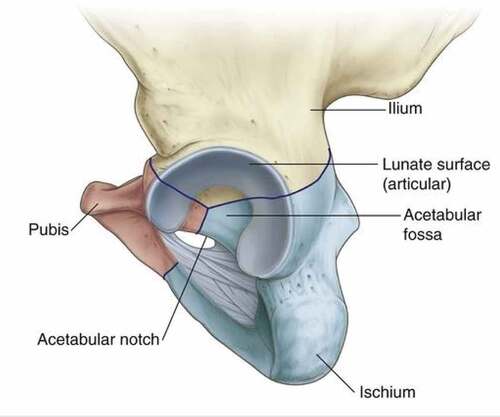
Figure 5. Cross-section of the femur (Gray, Citation1960; Izzo, Citation2012b).
Figure 6. Centre of gravity (Gray, Citation1960).
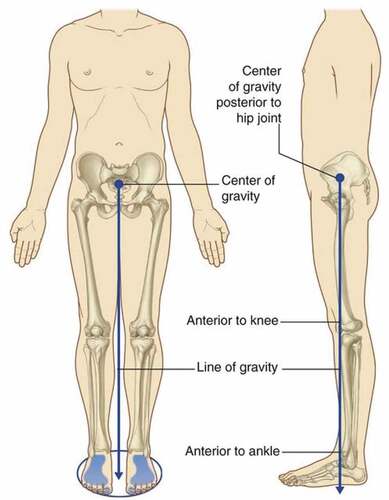
Table 1. Comparison between textbook references: Active Range of Motion of the Adult hip [in Degrees] (Roach & Miles, Citation1991; Sankar et al., Citation2012)
Figure 7. Motions of the hip joint (Joumana Medlej, Citation2014).
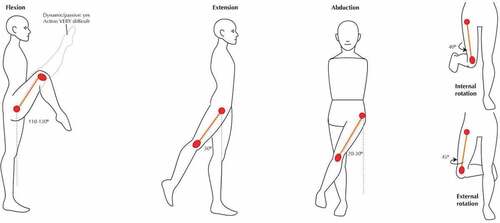
Figure 8. Sagittal view of the right hip (Izzo, Citation2012b; Izzo, Citation2012a).
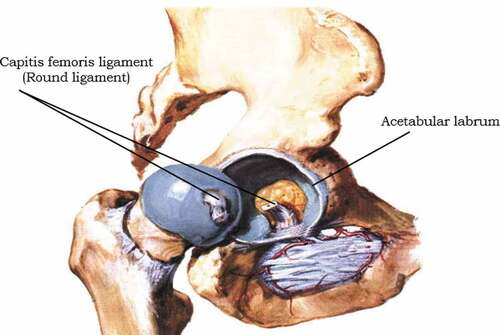
Figure 9. Anterior and posterior view of the hip joint (Jones, Citation2019).
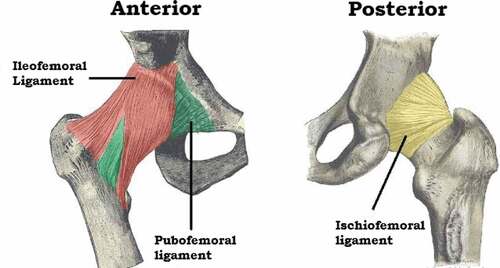
Figure 10. Schematic diagram of a total hip replacement, indicating the different components (Grandjean et al., Citation2012).
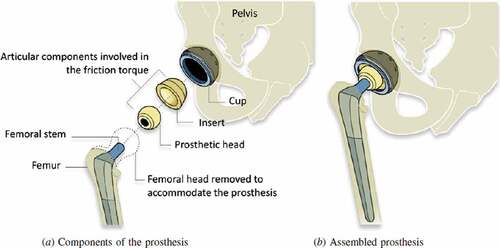
Figure 11. THR revisions (Burger et al., Citation2007; Ulrich et al., Citation2008).
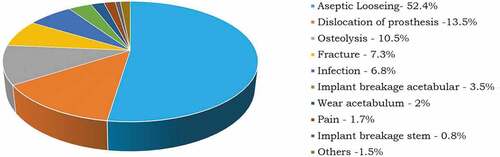
Figure 12. THA procedure year-wise (Brittain et al., Citation2019).
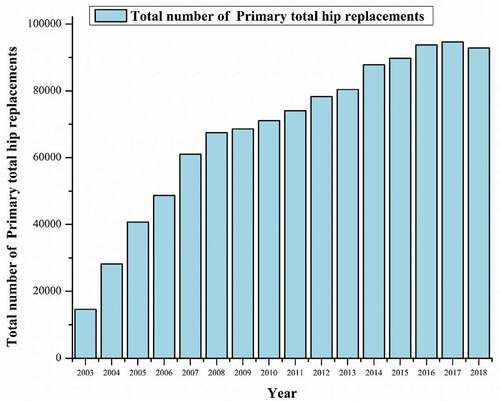
Table 2. Shows some of the finite element analysis studies performed on hip implants