Figures & data
Table 1. Chemical properties of the Se75−x–Te25–Agx (x = 0, 2, 4, 6, 8, and 10 at%) chalcogenide glasses
Table 2. Absorption edges of the constituent elements under investigations as illustrated by Hubbell and Seltzer (Citation1995)
Figure 1. MAC values of the STA1–STA6 chalcogenide glasses vs photon energy and Ag content.
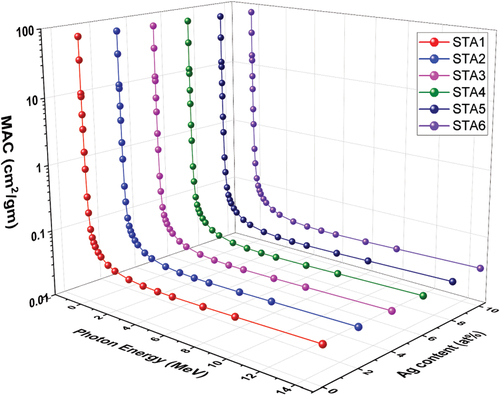
Figure 2. LAC values of the STA1–STA6 chalcogenide glasses vs photon energy and Ag content.
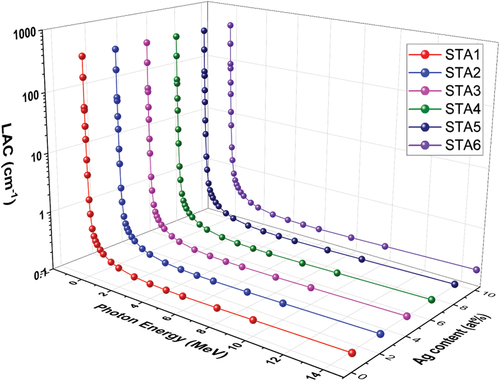
Table 3. LAC values of the STA1–STA6 glasses compared with those of commercial glasses as given at SCHOTT (Citation2022) company website SCHOTT
Figure 3. HVL values of the STA1–STA6 chalcogenide glasses vs photon energy and Ag content.
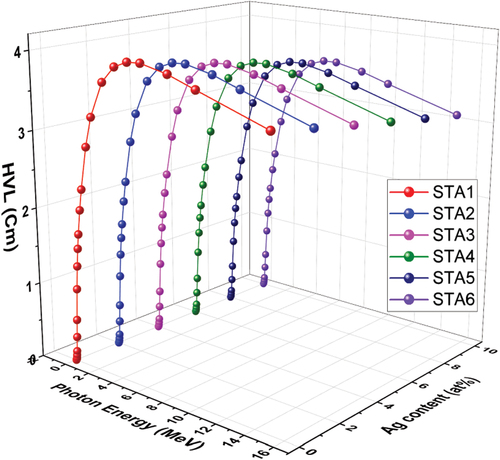
Figure 4. TVL values of the STA1–STA6 chalcogenide glasses vs photon energy and Ag content.
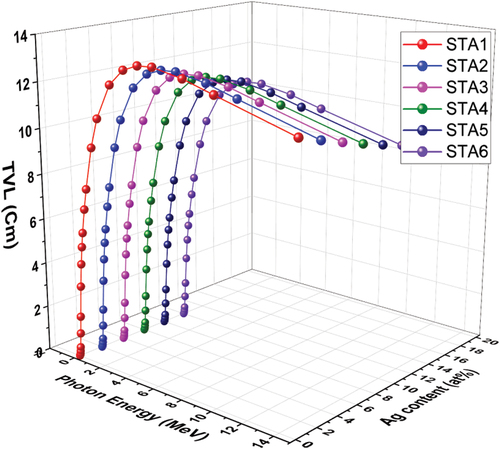
Figure 5. MFP values of the STA1–STA6 chalcogenide glasses vs photon energy and Ag content.
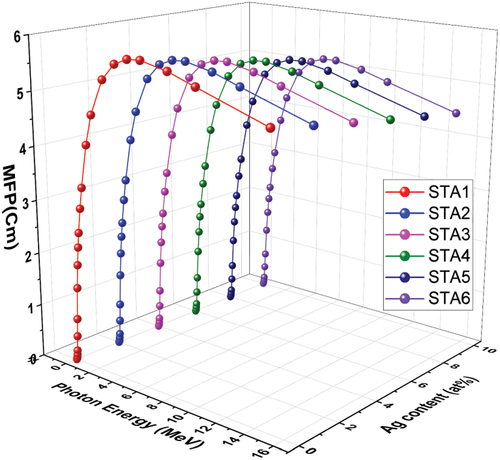
Figure 6. HVL values of the STA1–STA6 chalcogenide glasses compared with those of some commercial, traditional glasses and chalcogenide glass. Also, the inset shows a zoomed view of the curves.
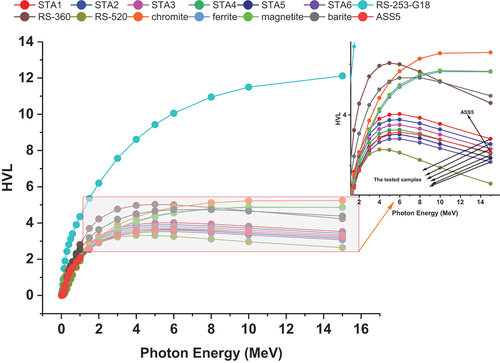
Figure 7. MFP values of the STA1–STA6 chalcogenide glasses compared with those of some commercial, traditional glasses and chalcogenide glass. Also, the inset shows a zoomed view of the curves.
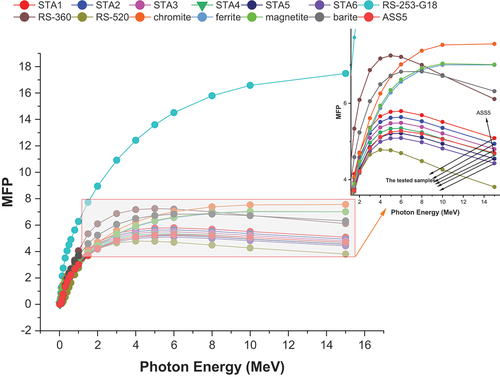
Figure 8. ACS values of the STA1–STA6 chalcogenide glasses vs photon energy and Ag content.
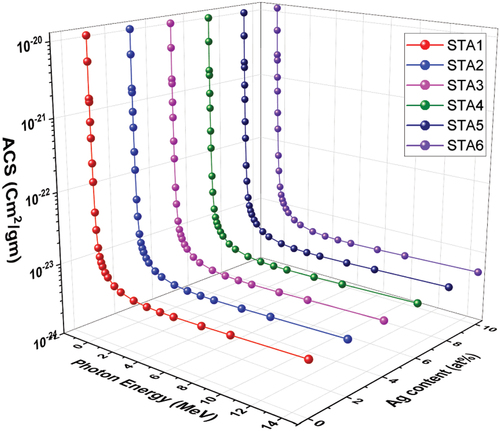
Figure 9. ECS values of the STA1–STA6 chalcogenide glasses vs photon energy and Ag content.
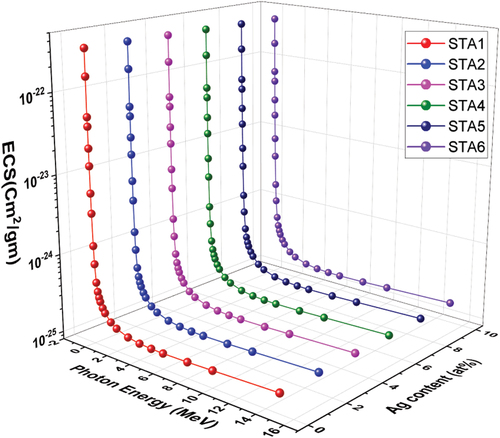
Figure 10. Zeff values of the STA1–STA6 chalcogenide glasses vs photon energy.
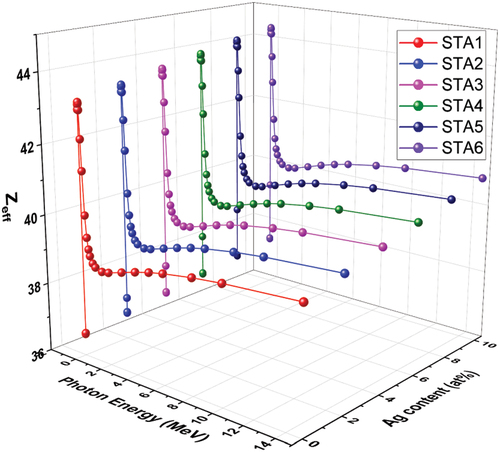
Figure 11. Neff values of the STA1–STA6 chalcogenide glasses vs photon energy and Ag content.
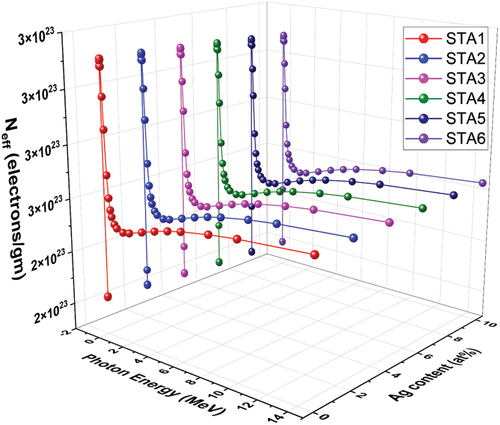
Figure 12. Ceff values of the STA1–STA6 chalcogenide glasses vs photon energy and Ag content.
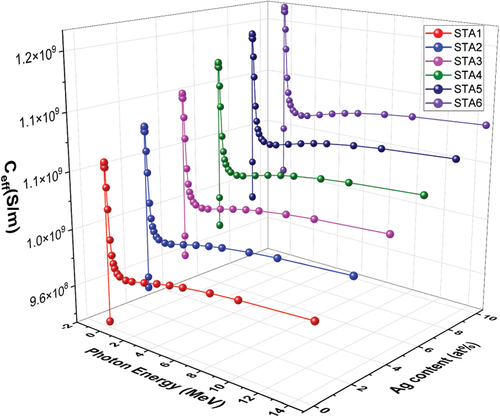
Figure 13. R values of the STA1–STA6 chalcogenide glasses vs photon energy and Ag content.
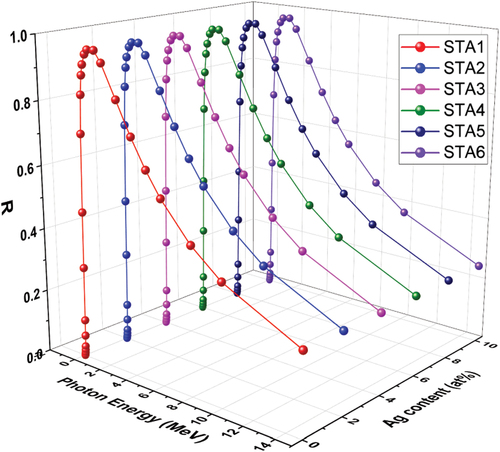
Figure 14. Zeq values of the STA1–STA6 chalcogenide glasses vs photon energy and Ag content.
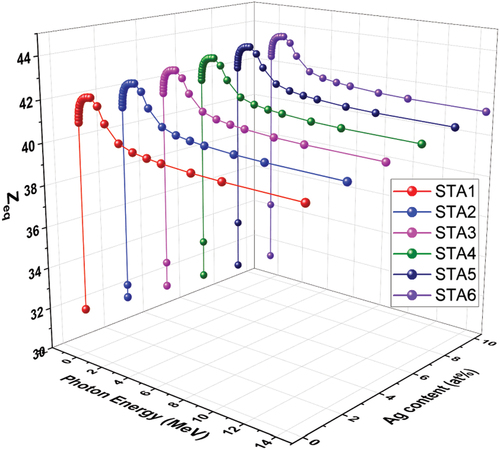
Figure 15. EBF values of the (a)STA1, (b) STA3, and (c) STA6 glasses vs photon energy.
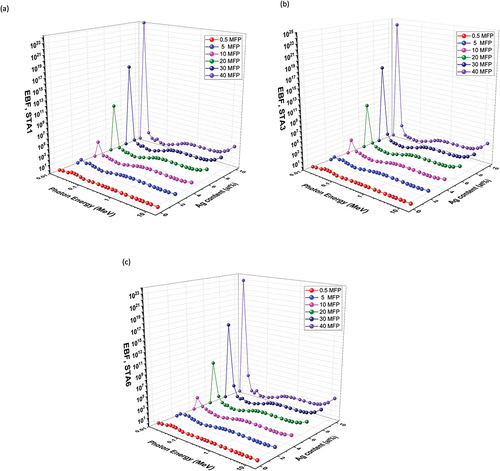
Figure 16. EABF values of the (a) STA1, (b) STA3, and (c) STA6 glasses vs photon energy.
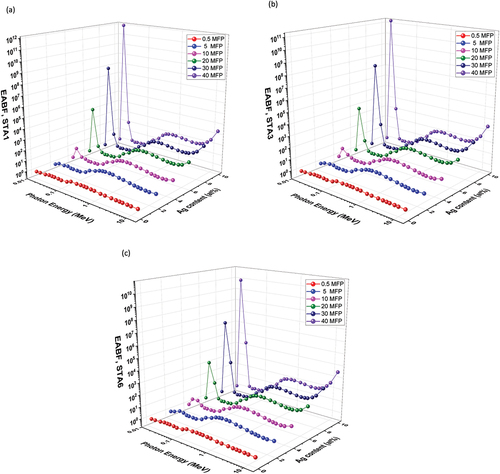
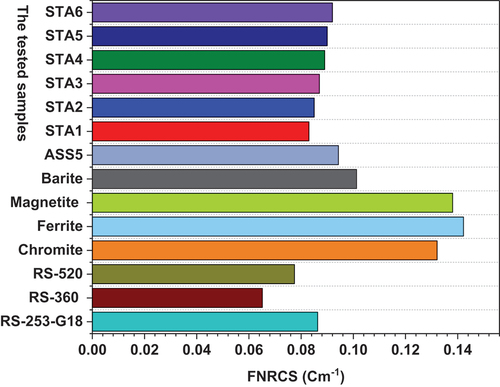
Figure 17. FNRCS values of the STA1–STA6 chalcogenide glasses compared with those of some commercial, traditional glasses and chalcogenide glass.