
Figures & data
Table 1. Works concerning effects of N2 and H2 in diffusion flames
Table 2. Flame conditions and fuel concentrations
Figure 1. Comparison of simulated temperature profiles (right half) with measurements (Sun et al., Citation2017; left half) of undiluted and diluted flames with addition cases (a) and replacement cases (b). The data only exists for limited portions of the flame area with an uncertainty of ±100 K without correction for radiation. However, for the available parts, simulated temperature qualitatively agrees with the experimentally observed changes with different dilution cases.
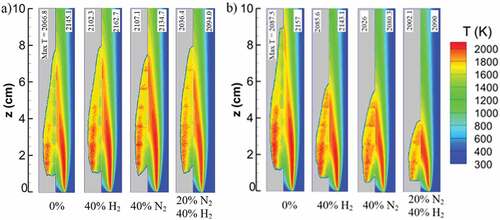
Figure 2. Computed (lines) and measured (symbols; Sun et al., Citation2017) soot volume fraction on flame wing (a,b) and centerline (c,d) at different heights above the burner for H2, N2 and mixed addition and replacement. Simulations capture the overall soot distribution through the flame height, peak point position and smaller variations downstream of the flames. Simulated flame positions are slightly higher than the measurements, approximately less than 5 mm (see supplemental material). The predicted peak values for flames wing and centerline are within 22% and 43% of the experimental data, respectively.
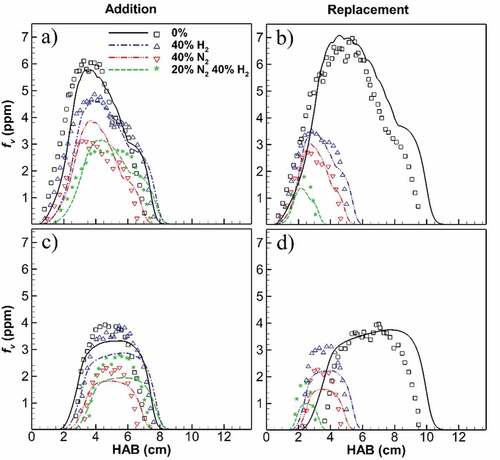
Figure 3. Comparison of the maximum soot primary particle diameter (dp) for diluted and undiluted flames at the location of (a) centerline (b) entire flame. High overpredicting uncertainties of the LII measurements (Sun et al., Citation2017) results in bigger dp values. However, simulation accurately captures the trend of changes for H2 and N2 cases with the results being within 8% of the experiment if normalized by their undiluted dp. Primary particle size reduces with dilution and a higher reduction recorded for N2 dilution. Replacement cases result in greater reduction compared to additions.
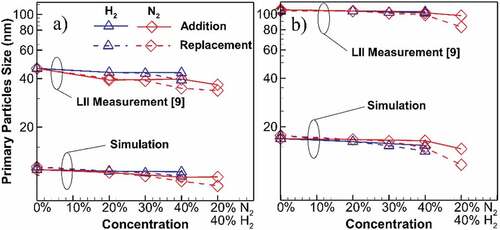
Figure 4. Ratio of the accumulated soot mass from 3 processes in the diluted flames to the values of undiluted flame, at flame wing (a, b) and centerline (c, d). At the wing, slight inception growth occurs for H2 dilution with positive slope in addition cases, while it is reducing for N2 dilution. Both HACA and PAH adsorption mass contributions reduce for all dilution cases, with greater reductions for PAH adsorption. At flame centerline, except for H2 addition where HACA shows a slight increase, all other processes decrease for all cases. At wing and centerline, the degree of the reductions increases for N2 dilution and replacement cases.
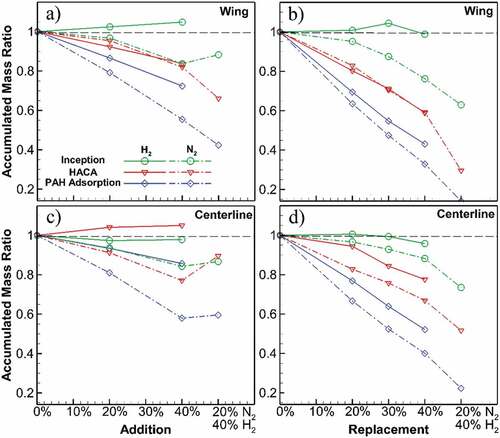
Figure 5. Maximum rates of HACA and PAH adsorption throughout the undiluted and diluted flames at 40% addition (a) and replacement (b). Both processes decrease due to dilution, whereas N2 has a greater effect compared to H2. While H2 results in a reduction of at most 19% in HACA rate, N2 reduces HACA rate by 30%. Same reductions occur for PAH adsorption rate with 13% and 37% for H2 and N2, respectively.
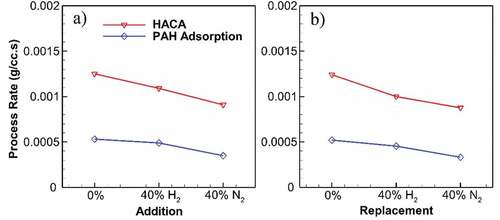
Figure 6. Temperature–time history and maximum soot volume fraction of the undiluted flame and diluted flames through addition and replacement cases based on flame wing (a, b) and centerline (c, d). Temperature–time history closely follows the trendline of the maximum soot volume fraction in replacement cases showing its dominance. For addition cases, however, soot volume fraction has a more rapid reduction compared to temperature–time history.
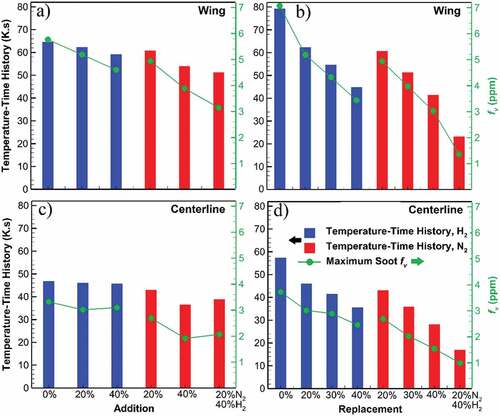
Figure 7. Maximum carbon to soot conversion for addition and replacement flames at different diluent concentrations. Higher amount of diluent results in linear reduction of conversion with higher slope for N2 compared to H2 cases.
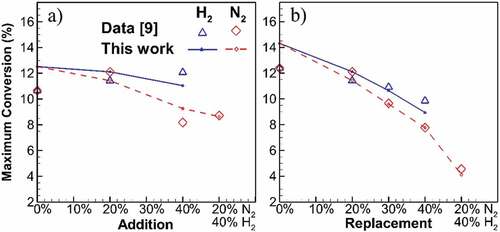
Figure 8. Maximum PAH concentration along flame height for undiluted flame and diluted flames at 40% addition (a) and replacement (b). First peak lies on flame wing at lower HAB and zones of soot inception onset. H2 and N2 addition, respectively, result in 25% and 65% reduction in PAH concentration at the location of first peak for undiluted ethylene. The first peak is delayed by H2 and greater by N2 addition, leading to shorter inception and consequently growth zone through flame height. H2 and N2 replacement, respectively, result in 19% and 30% reduction in PAH concentration at the location of first peak for undiluted ethylene. The first peak and top end of the graph are significantly closer for both H2 and N2 replacement, leading to shorter inception and consequently growth zone through flame height.
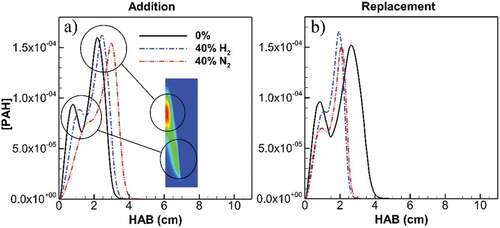
Figure 9. Primary particle number density at HAB = 1 cm on flame wing for undiluted flame and diluted flames at 40% addition and replacement. H2 addition significantly declines the number density to 52% of its value for undiluted ethylene, followed by N2 addition reducing it to 43%. At replacement, H2 reduces the number density to 69% of its value for undiluted ethylene, followed by N2 dilution reducing it to 61%.
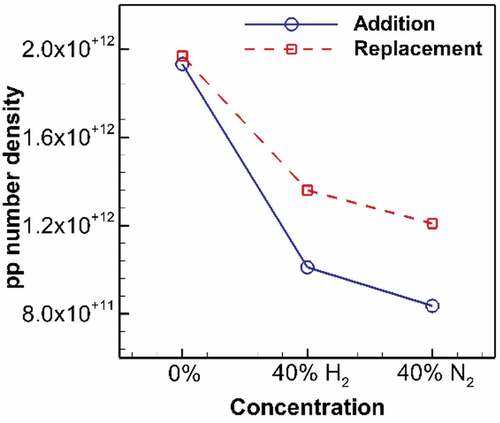
Figure 10. Maximum acetylene concentration along flame height for undiluted flame and diluted flames at 40% addition (a) and replacement (b). Despite a longer acetylene presence for diluted flames in addition cases, acetylene concentration is constantly lower than its value at undiluted ethylene flame at flame parts corresponding to growth zones. The difference peaks at 8% for H2 and 20% for N2 addition. With replacement, acetylene concentration of diluted flames is lower than its value at undiluted ethylene flame. Inside the flame height, the concentration difference peaks at 15% for H2 and 21% for N2 replacement. Also, the top end of acetylene presence is significantly lowered by both H2 and N2 at approximately 40%.
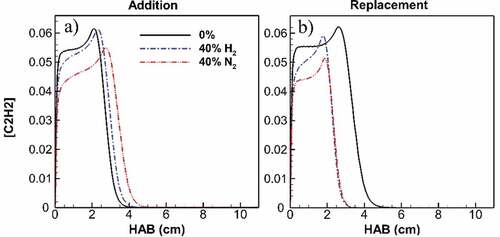
Figure 11. Main chemical pathways from ethylene to C2H2 and benzo[a]pyrene for an equivalent perfectly stirred reaction modeling with the temperature and residence times at the onset of soot formation in the current flames. Arrows in red indicate reactions where hydrogen plays an enhancing role with the species production rate (mole/cc.sec) of 40% dilutions with H2 and N2. Arrows with dashed lines indicate collapsed series.
![Figure 11. Main chemical pathways from ethylene to C2H2 and benzo[a]pyrene for an equivalent perfectly stirred reaction modeling with the temperature and residence times at the onset of soot formation in the current flames. Arrows in red indicate reactions where hydrogen plays an enhancing role with the species production rate (mole/cc.sec) of 40% dilutions with H2 and N2. Arrows with dashed lines indicate collapsed series.](/cms/asset/be943866-0518-4d9f-8bb6-716b6f14109c/oaen_a_2130192_f0011_oc.jpg)
Table 3. Production rate of acetylene and benzo[a]pyrene PAH (mole/cc.sec) for different flames of undiluted ethylene, 40% H2 addition and 40% N2 addition at different positions in lower flame using an equivalent chemical analysis of perfectly stirred reaction modeling; HAB 1: Temperature = 1000 K, HAB 2: Temperature = 1266 K, HAB 3: Temperature = 1400 K. While both diluents result in the reduction of the species, N2 dilution delays the formation of acetylene and PAH to higher HAB and temperature, losing a significant height in lower flame for soot inception and growth