
Figures & data
Table 1. Summary of some of the related literatures review
Figure 1. (a) Geometry, (b) mesh, and (c) twisted tape.
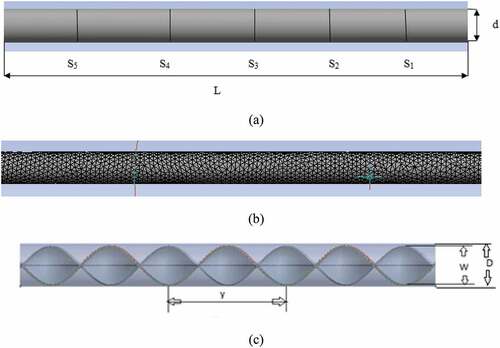
Table 2. Thermophysical properties of water and hybrid nanofluid Al2O3-Cu/water (Hamdi et al., Citation2019)
Figure 2. Grid resolution test for PTT tube. (a) Cell_ 26028449 (Model 1). (b) Cell_3364281 (Model 3). (c) Cell_3114836 (Model 2).
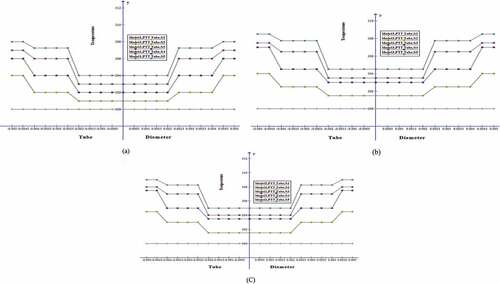
Figure 3. Comparison of Nusselt number of water and 1% hybrid nanofluid in a circular tube.
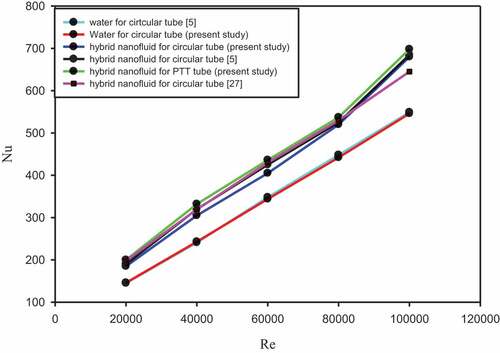
Figure 4. Comparison friction factor of 1% hybrid nanofluid in circular tube and PTT tube.
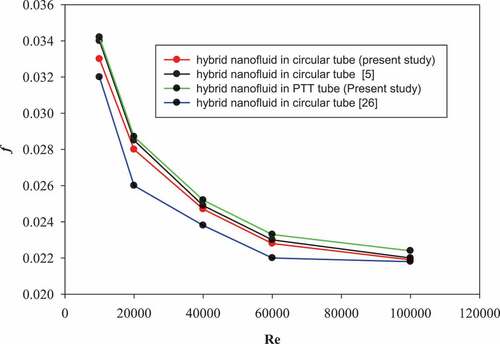
Figure 5. PEC of 1% Al2O3-Cu/water hybrid nanofluid in PT and PTT tube.
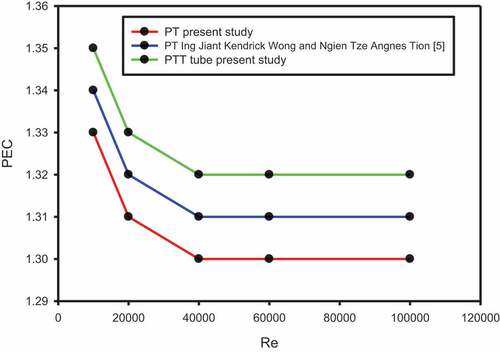
Figure 6. Temperature contour plot for PT for water, Re = 20,000, at different axial locations.
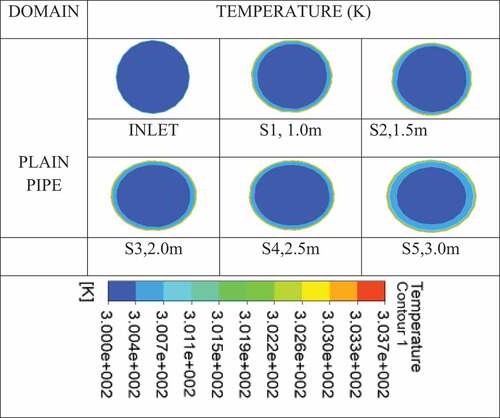
Figure 7. Temperature contour plot for PT for Al2O3-Cu/water, Re = 20,000, at different axial locations.
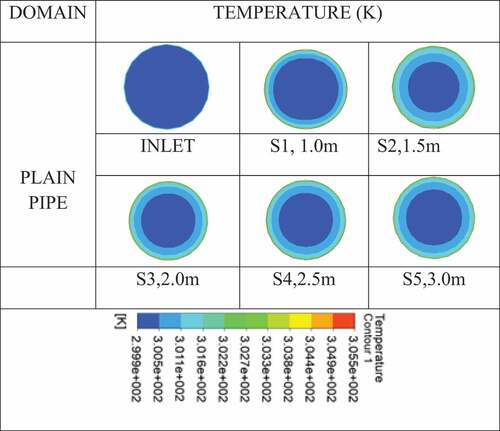
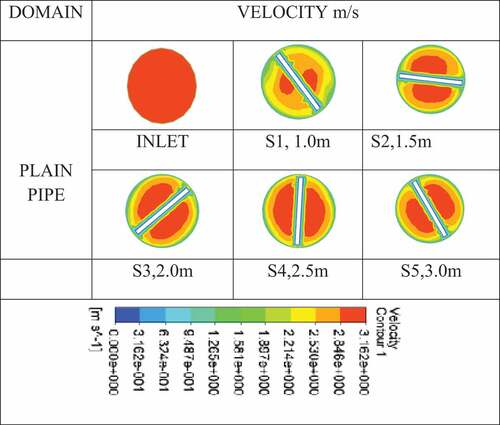
Figure 8. Velocity contour plot for PT for Al2O3-Cu/water, Re = 20,000, at different axial locations.
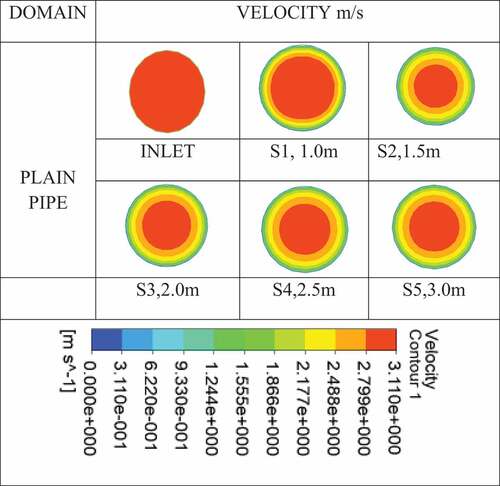
Figure 9. Temperature contour plot for PTT for Al2O3-Cu/water, Re = 20,000, at different axial locations.
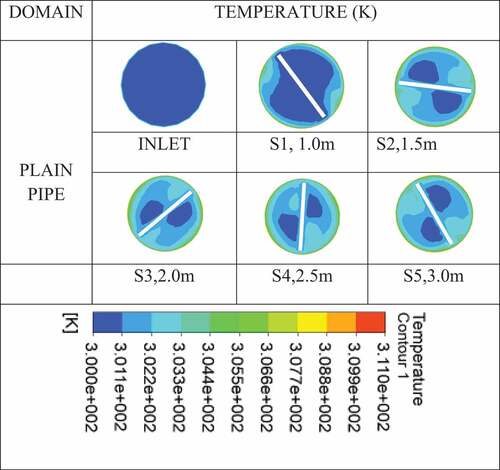
Figure 10. Velocity contour plot for PTT for Al2O3-Cu/water, Re = 20,000, at different axial locations.
Table