Figures & data
Figure 1. Schematic of uniform sand-grain roughness model (Adams et al., Citation2012; ANSYS, Citation2019).
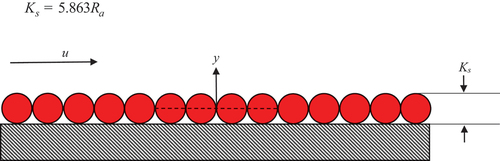
Table 1. Surface roughness level (JIS, Citation2013)
Figure 2. Scheme of journal bearing with surface roughness, (a) top view, (b) front view.
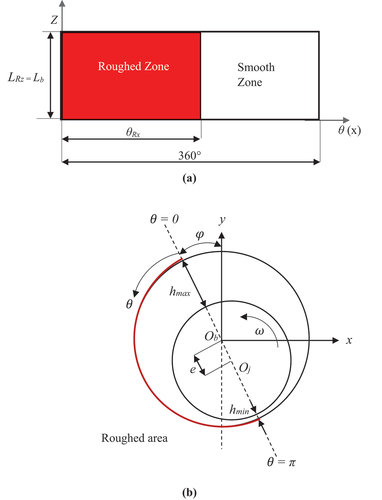
Table 2. Journal bearing parameter
Figure 3. Results of the independence mesh study.
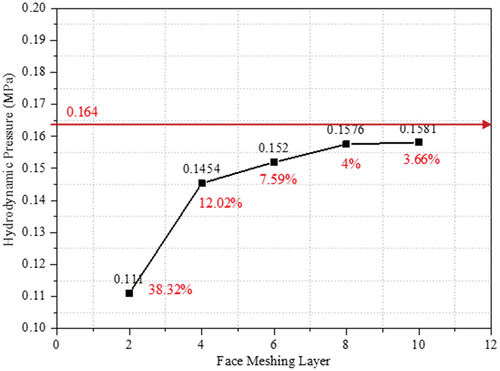
Figure 4. Representation in three dimensions of the meshed journal bearing.
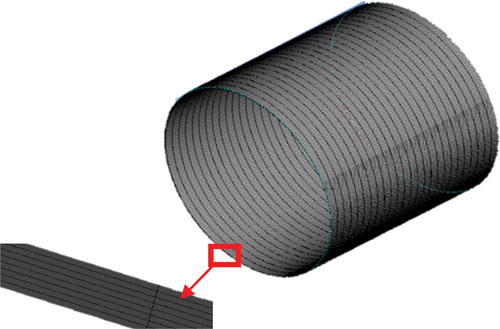
Figure 5. Boundary condition of journal bearing.
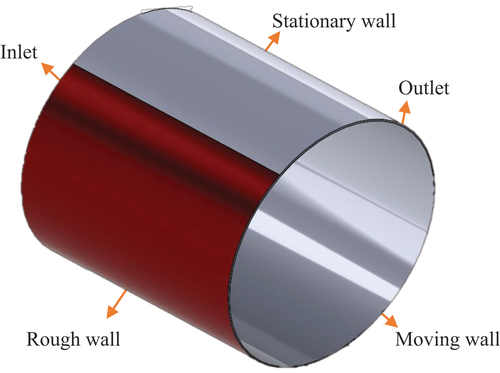
Figure 6. Comparison between the result of the present investigation and the references (Gertzos et al., Citation2008; Wada et al., Citation1974).
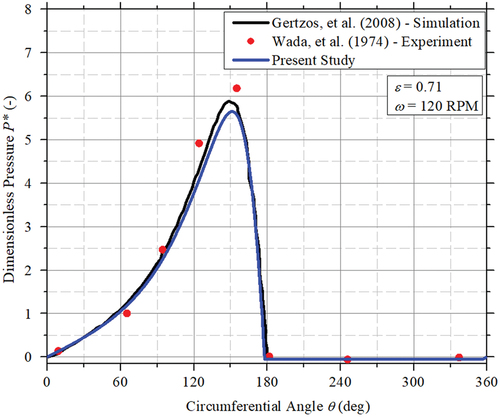
Figure 7. Effect of surface roughness level on (a) load-carrying capacity, (b) friction force, and (c) average acoustic power level.
Figure 8. Distribution of hydrodynamic pressure of the bearing varying surface roughness levels.
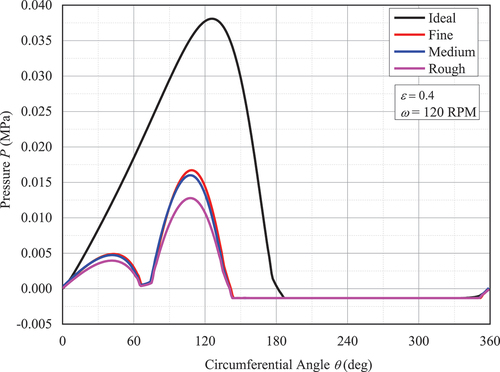
Figure 9. Comparison of pressure contour of the bearing for several roughness levels: (a) Ra = 0 μm (Smooth), (b) Ra = 0.4 μm (Fine), (c) Ra = 1.6 μm (Medium), Ra = 12.5 μm (Rough).
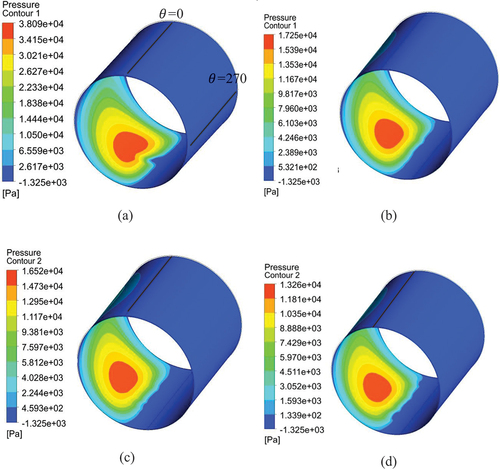
Figure 10. Distribution of hydrodynamic pressure and vapor volume fraction varying surface roughness levels.
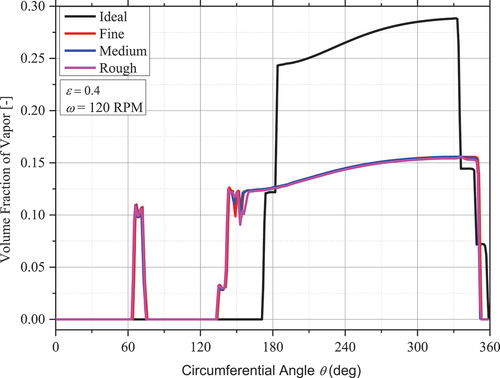
Figure 11. Effect of eccentricity ratio on (a) load-carrying capacity, (b) friction force, and (c) average acoustic power level of the roughed journal bearing.
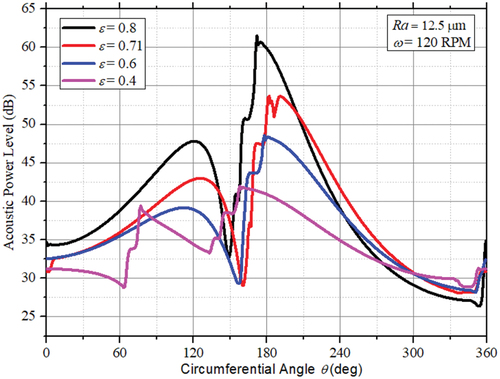
Figure 12. Distribution of acoustic power level of roughed journal bearing varying eccentricity ratios.