Figures & data
Figure 1. Aerodynamic characteristics with a 0.01c-high flap located at the trailing edge on the upper and lower surfaces (Maughmer & Bramesfeld, Citation2008).
Figure 2. Airfoil design with parameters to be varied.
Table 2. Geometric and operational parameters
Figure 3. Extent of domain and mesh, showing the boundary conditions used for the study.
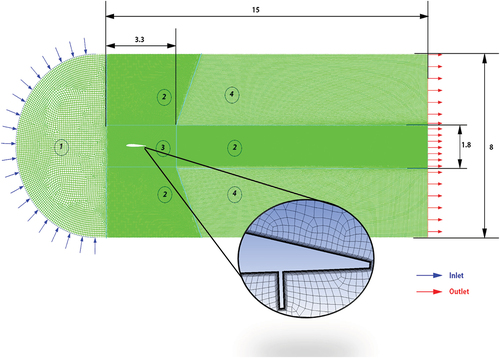
Table 1. Mesh sensitivity analysis
Figure 4. Validation plot of Cl with experimental data (Jacobs & Pinkerton, Citation1936).
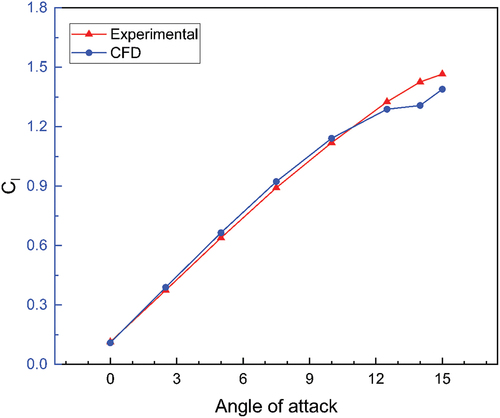
Figure 5. Validation plot of Cd with experimental data (Jacobs & Pinkerton, Citation1936).
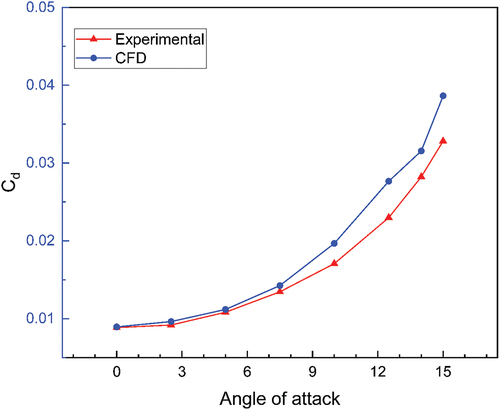
Figure 6. Comparison of Cl values obtained from CFD and experimental data (Maughmer & Bramesfeld, Citation2008).
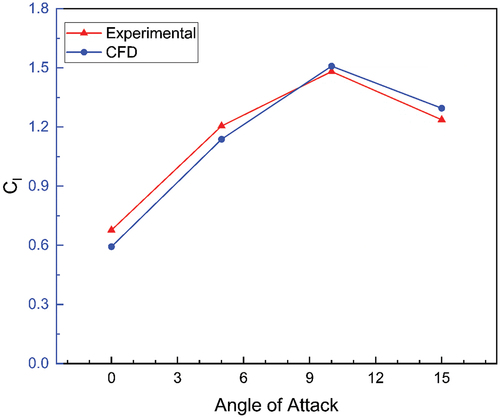
Figure 7. Flowchart of steps carried out during the study.
Figure 8. (A) Cl vs AoA 1-YY, (B) Cl vs AoA 2-YY, (C) Cl vs AoA 3-YY, (C) Comparison of Cl among best configurations with 1, 2 and 3% c flaps.
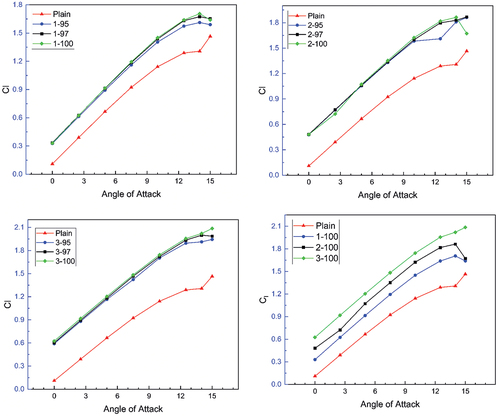
Figure 9. (A) Cd vs AoA 1-YY, (B) Cd vs AoA 2-YY, (C) Cd vs AoA 3-YY, (C) Comparison of Cd among best configurations with 1, 2 and 3% c flaps 33.
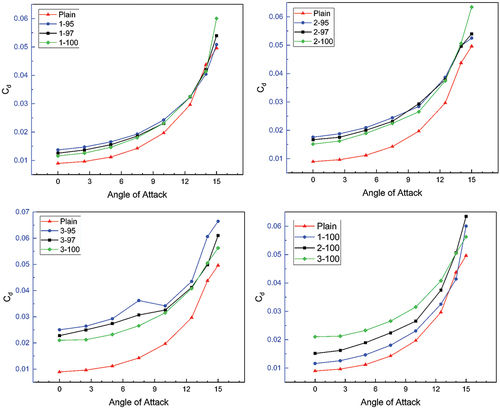
Figure 10. Comparison of drag coefficients with varying flap height at AoA = 7.5° 35.
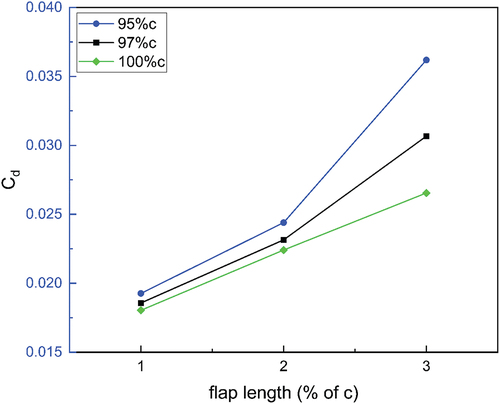
Figure 11. (A) Cl/Cd vs AoA 1-YY, (B) Cl/Cd vs AoA 2-YY, (C) Cl/Cd vs AoA 3-YY, (C) Comparison of Cl/Cd among best configurations with 1, 2 and 3% c flaps.
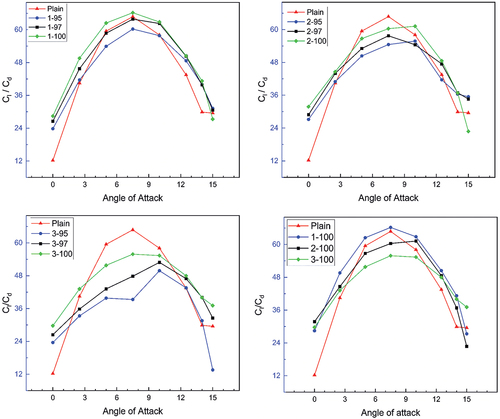
Table 3. Maximum values of Cl/Cd for each configuration
Figure 12. Pressure contours for (A) Plain wing at 10° AoA (B) TE of Plain wing at 10° AoA (C) 1–95 at 10° AoA (D) TE of 1–95 at 10° AoA (E) 2–95 at 10° AoA (F) TE of 2–95 at 10° AoAA.
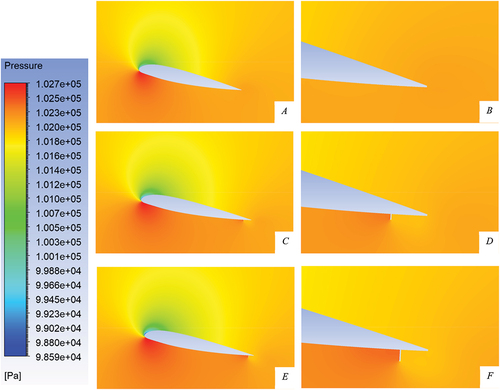
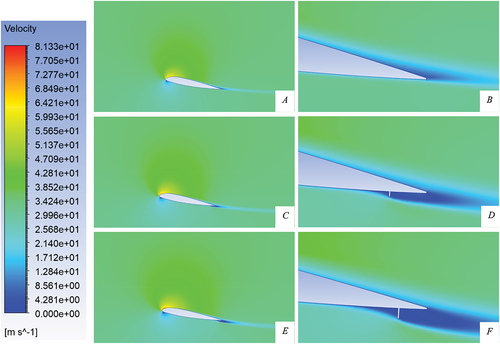
Figure 13. Velocity contours for (A) Plain wing at 10° AoA (B) TE of Plain wing at 10° AoA (C) 1–95 at 10° AoA (D) TE of 1–95 at 10° AoA (E) 2–95 at 10° AoA (F) TE of 2–95 at 10° AoAC.