
Figures & data
Figure 1. Flowchart of machine learning techniques and regression models.
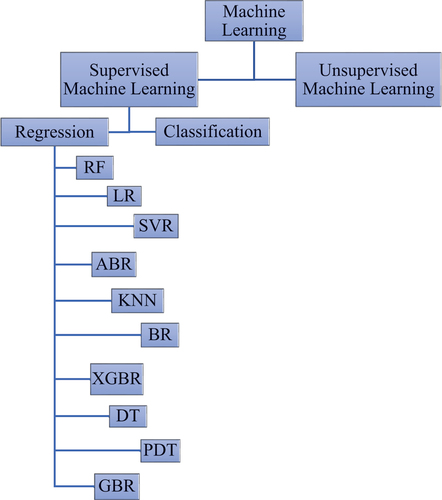
Table 1. Comparative analysis among various methods with the ML models
Table 2. Prediction properties using different approaches (Ahmad, Ostrowski, et al., Citation2021)
Figure 2. Quantities of data type in percentage.
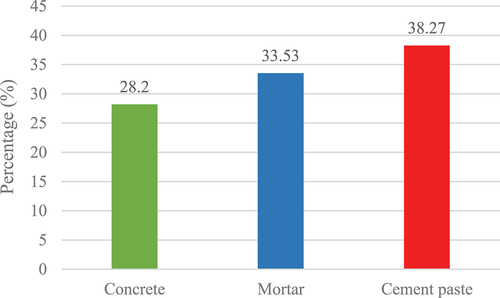
Figure 3. Flowchart of working steps on regression machine learning model.
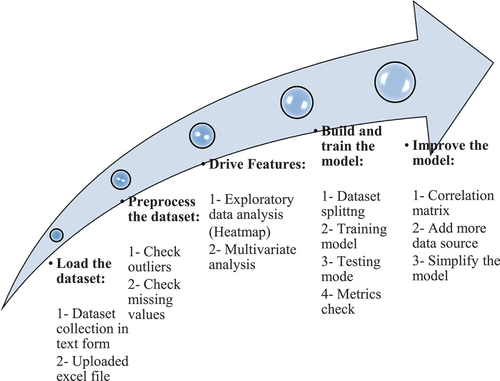
Table 3. Experimental dataset
Table 4. Parameters specification to develop model
Figure 4. Correlation heatmap between the independent and dependent parameters.
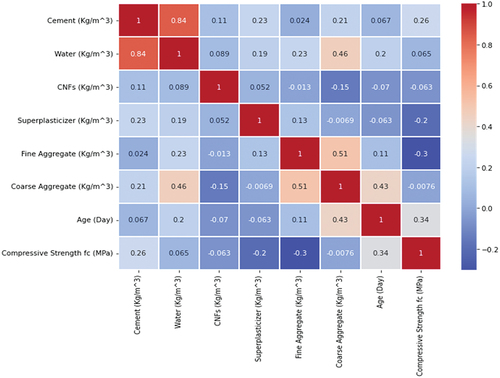
Figure 5. Box plot of the number of outliers in each independent variable.
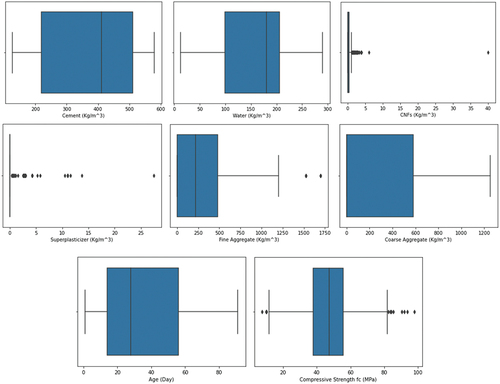
Table 5. Descriptive analysis of the input and output variables
Table 6. Outlier analysis of variables
Figure 6. Multivariate analysis of all input and output variable.
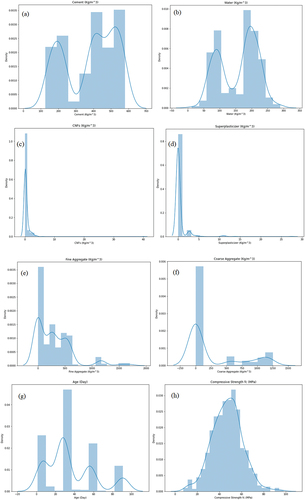
Figure 7. (a). The density curves of variables at X and Y axis: Cement, water, CNFs, and superplasticizers.
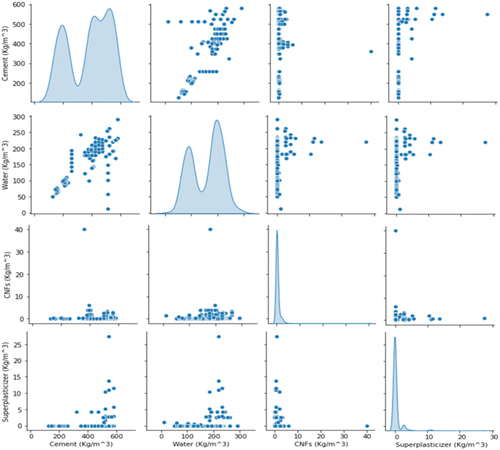
Figure 7. (b). The density curves of variables at X axis: Cement, Water, CNFs, and Superplasticizers; and Y axis: Fine aggregate, coarse aggregate, age and compressive strength fc.
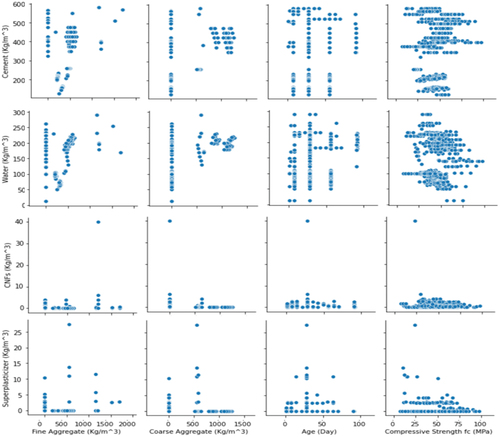
Figure 7. (c). The density curves of variables at X axis: Fine aggregate, coarse aggregate, age and compressive strength fc; and Y axis: Cement, water, CNFs, and superplasticizers.
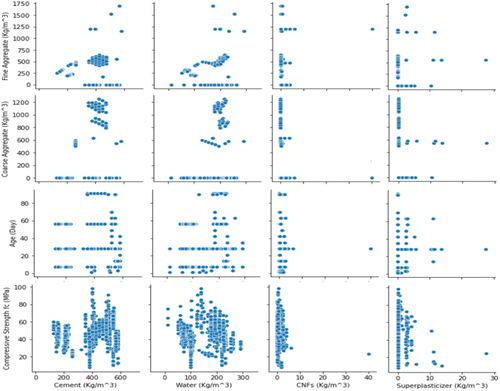
Figure 7. (d). The density curves of variables at X and Y axis: Fine aggregate, coarse aggregate, age and compressive strength fc.
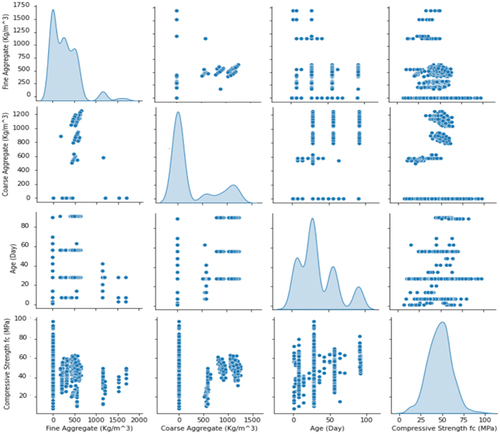
Figure 8. (a) R2 and (b) MAPE, RMSE, and MAE values of RF, GBR, ABR, KNN, BR, XGBR, and DT models.
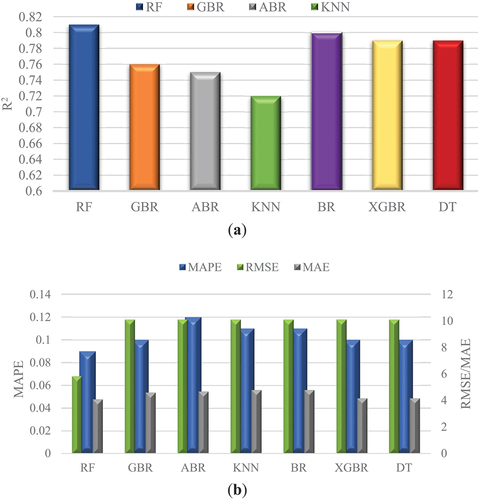
Table 7. Capability metrics of the supervised regression ML models
Figure 9. Scatter plot of R2 between the actual fc and predicted fc by (a) RF, (b) BR, (c) XGBR, and (d) DT models..
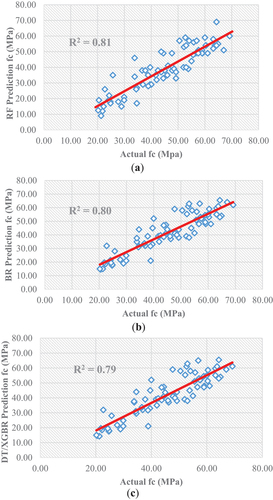
Figure 10. Scatter plot of R2 between the actual fc and predicted fc by (a) GBR and (b) KNN models..
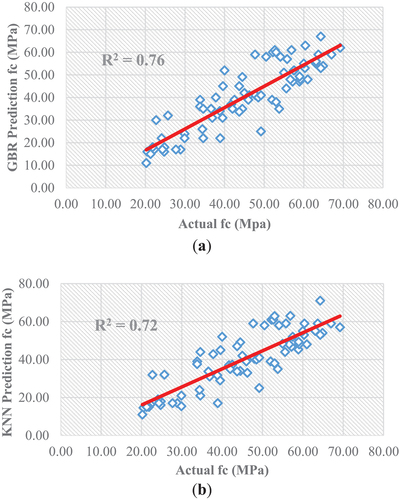
Figure 11. Scatter plot of R2 between the actual fc and predicted fc by ABR model..
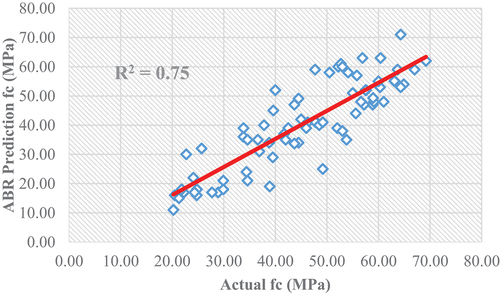
Figure 12. R2, RMSE, MAPE, and MAE of the best machine learning models RF, BR, and DT.
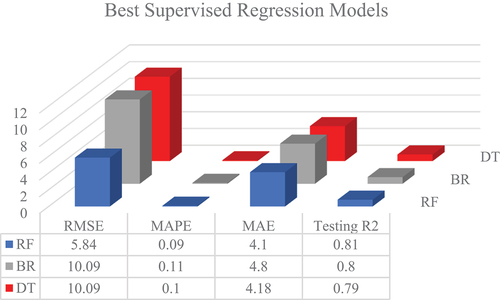
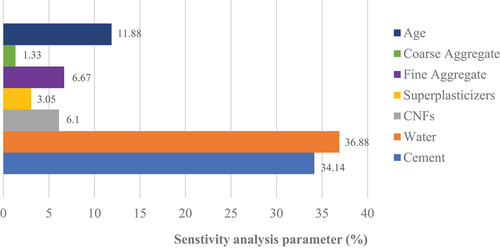
Figure 13. Contribution of independent parameters to output variable in Random Forest model.
Data availability statement
The data used to support the findings of this study are included in this published article.