
Figures & data
Table 1. The elemental composition for Alpha-Beta Brass alloy.
Figure 1. Sub sized ASTM standard tensile specimen.
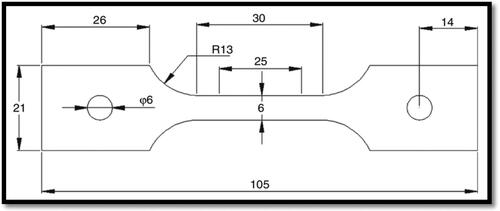
Figure 2. Experimental Samples.
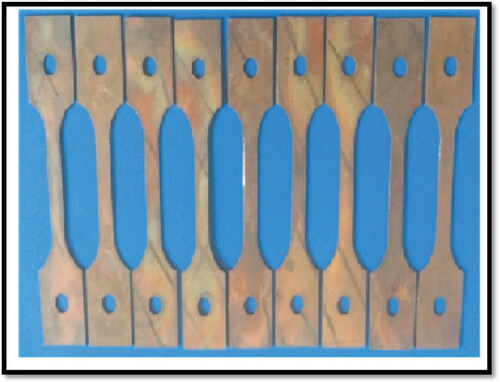
Figure 3. Universal testing machine with two split zone furnace.
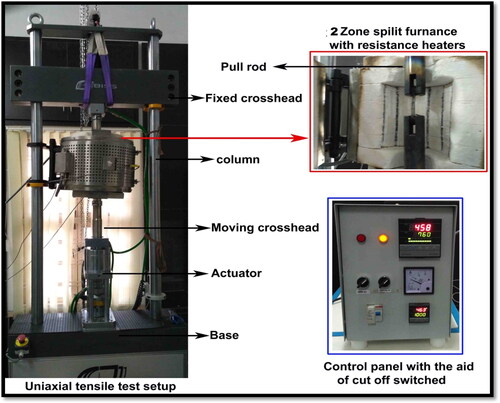
Figure 4. Sample location of deformed test specimen.
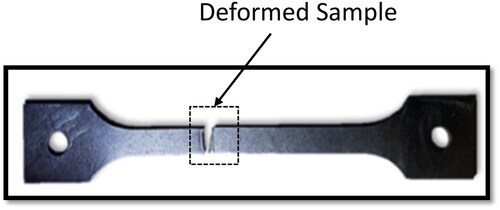
Figure 5. True stress versus true strain graphs of α-β brass alloy (a) with distinct temperatures at 0.1 s−1 rate of strain in RD (b) with different strain rates at 873 k. (a) With different temperatures at 0.1 s-1 strain rate. (b) With different strain rates at 873 K.
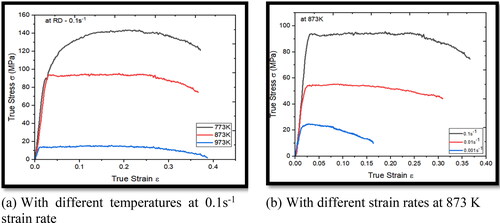
Table 2. Level of parameters.
Figure 6. True stress versus true strain graphs of α-β brass alloy at different orientation. (a) 673 K, (b) 773 K and (c) 873 K.
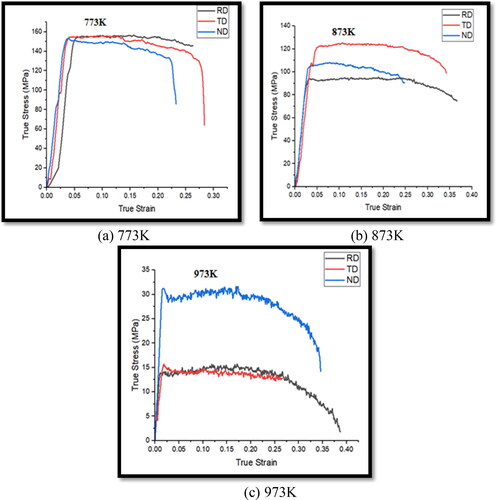
Figure 7. Variation of ln(strain rate) versus ln(stress) at various temperatures and strain rates.
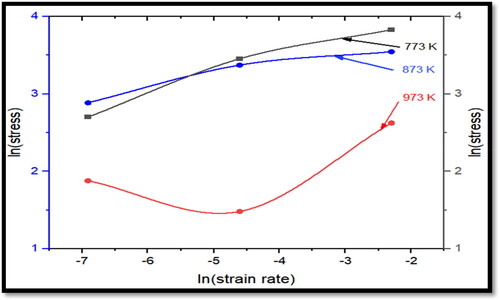
Table 3. Values for strain rate sensitivity (m).
Figure 8. Fracture tensile test specimens of α-β Brass alloy at (a) 773 K, (b) 873 K, and (c) 973 K.
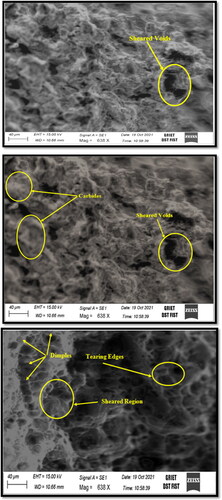
Figure 9. Comparison of the JC model projected flow stress for various strain rates and experimentally measured flow stress (a) at 773 K and (b) at 973 K.
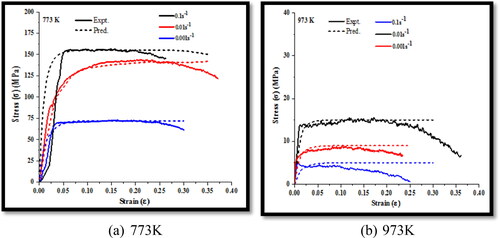
Table 4. Statistical parameters obtained for JC model.
Data availability statement
The authors confirm that the data supporting the findings of this study are available within the article any other data required will be available from the corresponding author, Bandhavi Challa, upon reasonable request.