
Figures & data
Figure 1. Carbon dioxide emissions from the cement and steel industry in 2019 (IEA, Citation2019).
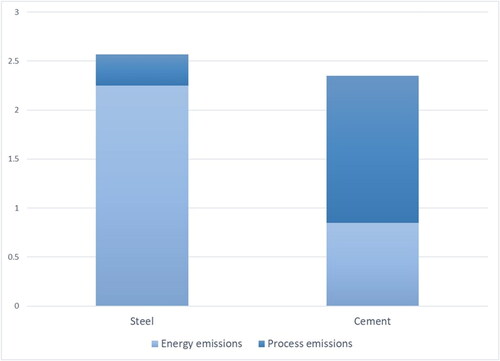
Figure 2. Phases of a life cycle assessment. Adapted from ISO 14040 (Citation2006b) and ISO 14044 (Citation2006c).
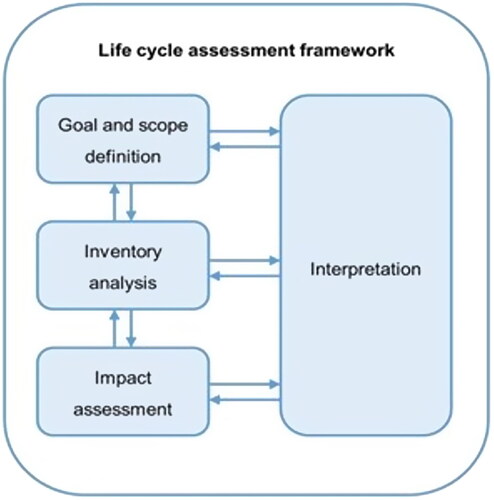
Figure 3. LCA modules of construction products adapted from EN 15804 (Citation2019).
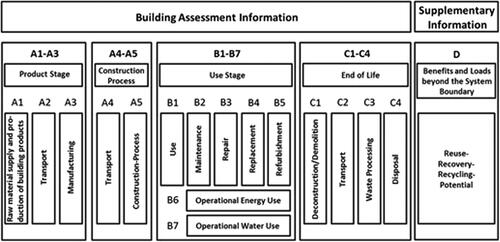
Figure 4. Defining SFRC material properties for beam modelling.
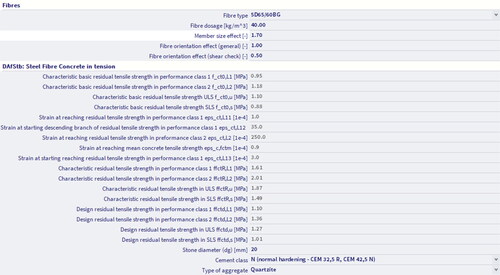
Table 1. Properties of modelled RC beams.
Table 2. Properties of modelled SFRC beams.
Table 3. Properties of traditional concrete.
Table 4. Properties of steel fibre-reinforced concrete.
Table 5. Properties of steel bars (B500 C).
Figure 5. The geometry of 5D steel fibres. Adapted from Abdallah et al. (Citation2016).
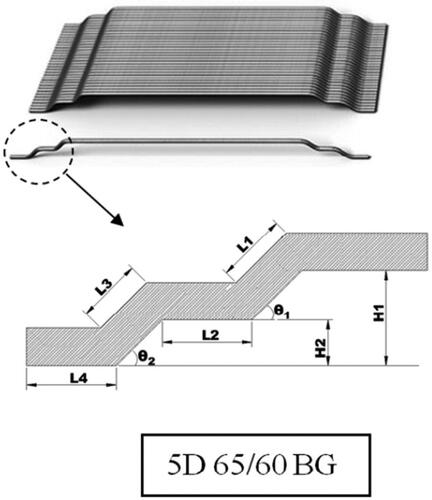
Table 6. Mechanical and geometric Properties of steel fibres (DRAMIX 5D).
Figure 6. Stress-strain distribution block in the cross-section. Adapted from Dlouhý and Pouillon (Citation2019).
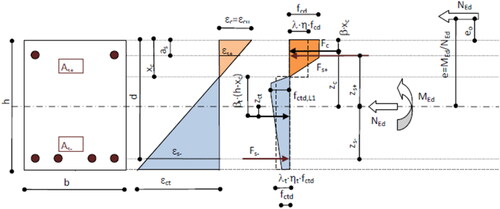
Figure 7. Minimum C/D to compressive strength of concrete (García-Taengua et al., Citation2014).
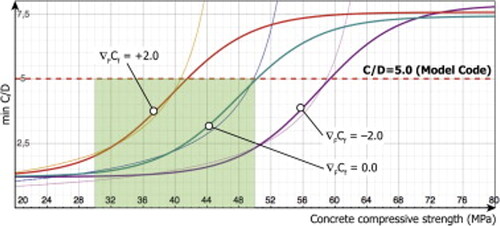
Figure 8. Displacement of simply supported RC beam under a loading condition in SCIA engineer.
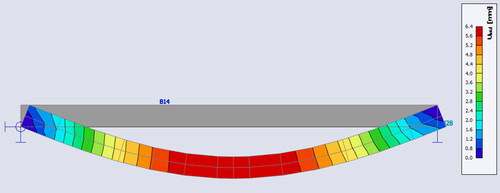
Figure 9. Displacement of SFRC beams under a given loading condition in SCIA engineer.
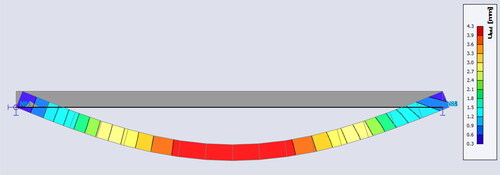
Figure 10. Shear force analysis of SFRC beam in SCIA engineer.
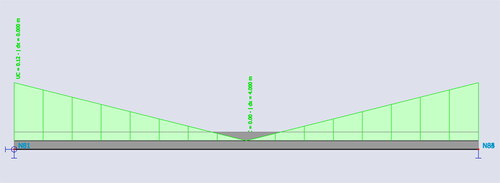
Figure 11. LCA system boundary for conventionally reinforced concrete.
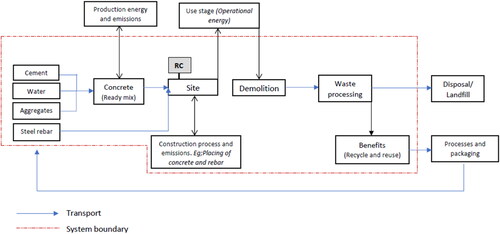
Figure 12. LCA system boundary for steel fibre-reinforced concrete.
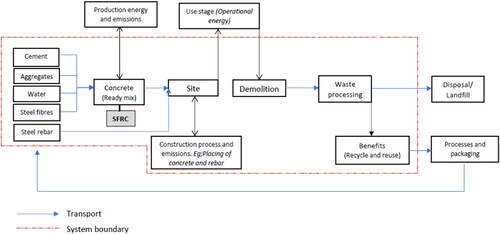
Table 7. Life cycle inventory data summary.
Table 8. Embodied carbon of construction materials.
Table 9. Base mix proportion for 30 MPa, 40 MPa and 50 MPa grade concrete.
Table 10. End-of-life scenario for the various elements.
Table 11. WLEC of RC and SFRC beams.
Figure 13. Embodied carbon of 4 m span RC and SFRC beams.
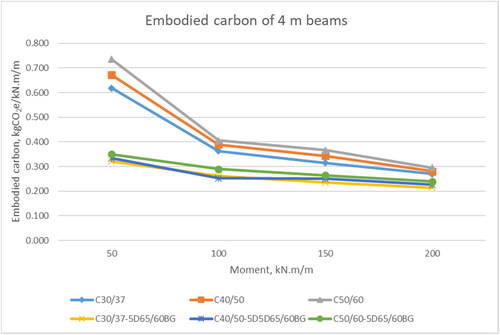
Figure 14. Embodied carbon of 6 m span RC and SFRC beams.
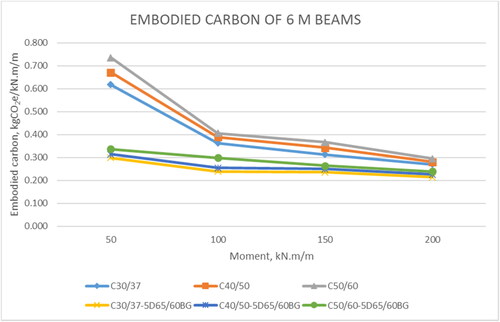
Figure 15. Embodied carbon of 8 m span RC and SFRC beams.
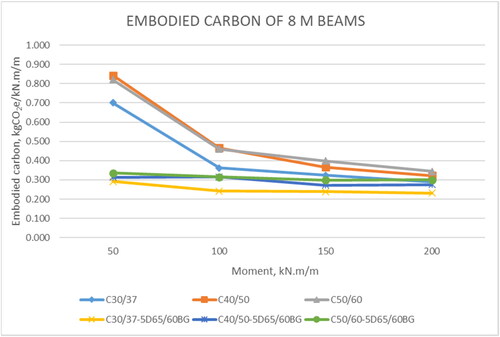
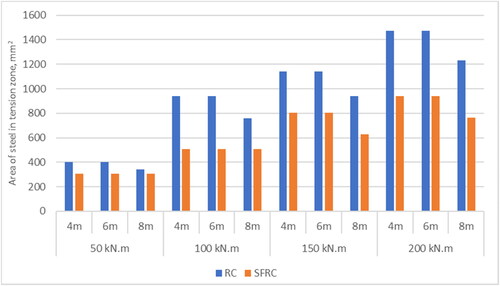
Figure 16. Area of steel provided in the tension zone of 30 MPa RC and SFRC beams.
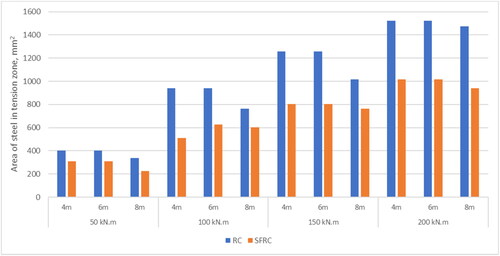
Figure 17. Area of steel provided in the tension zone of 40 MPa RC and SFRC beams.
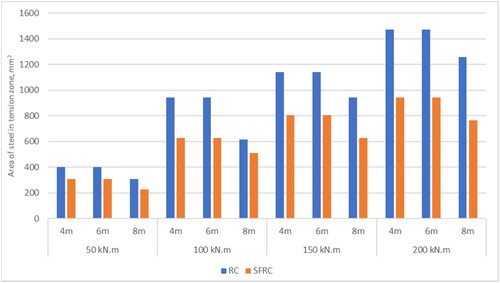
Figure 18. Area of steel provided in the tension zone of 50 MPa RC and SFRC beams.
Sample results verification.docx
Download MS Word (391.5 KB)Data availability statement
The data that support the findings of this study are available upon reasonable request. All inquiries regarding the data used for this study should be directed to the corresponding author, Gideon Osei Asare.