
Figures & data
Table 1. Chemical requirement for fly ash Class C and F as per ASTM C618-19 (25).
Table 2. Test matrices determine optimal sodium hydroxide molarity and sodium hydroxide to sodium silicate ratio.
Figure 1. Pressurized curing chamber.
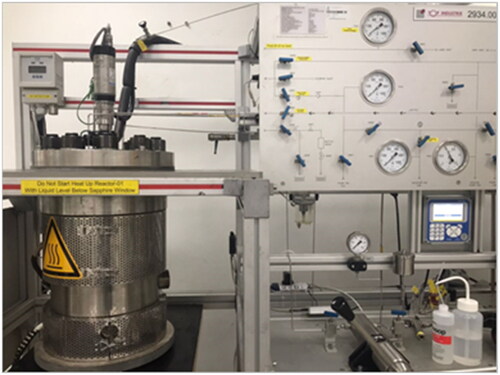
Figure 2. Result of Compressive Strength Test of Sodium hydroxide Molarity and Ratio of SH/SS from the formulation by using Design Expert.
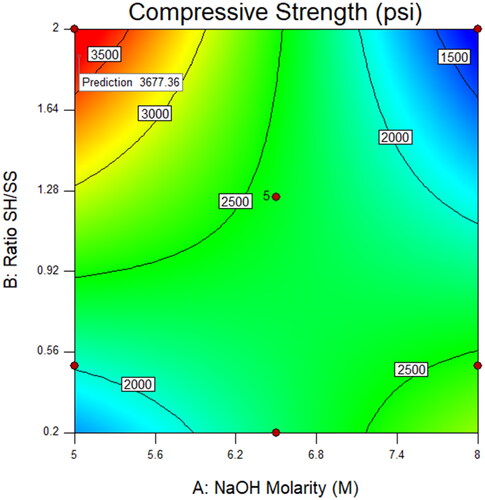
Figure 3. 2D contour represents the compressive strength results of GO concentration and sodium hydroxide molarity.
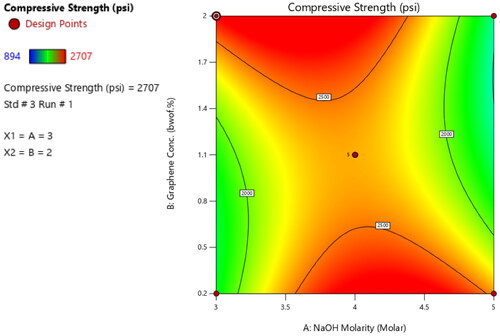
Table 3. Compressive strength result for Phase 1.
Table 4. Test matrices to determine optimal GO concentration.
Figure 4. 3D surface contour represents the variation of GO concentration and sodium hydroxide molarity to compressive strength.
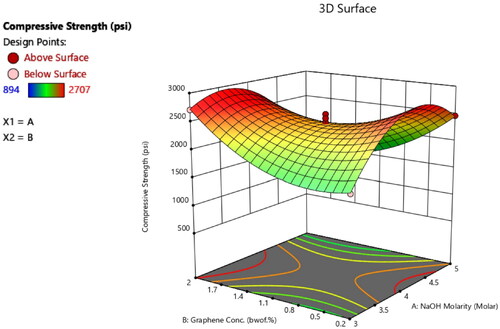
Table 5. Compressive strength result for Phase 2.
Figure 5. Desirability and compressive strength chart to find the optimum formulation.
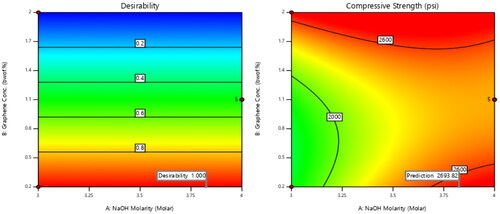
Table 6. Prediction of compressive strength at optimal sodium hydroxide molarity and graphene concentration from Design Expert.
Table 7. Rheology of the reference design at surface temperature and 60 °C.
Table 8. Rheology of the optimum design (Formulation OP 1) at surface temperature and 60 °C.
Table 9. Filtrate volume of the reference and optimum design at 60 °C.
Table 10. Thickening time for reference and optimum designs at 90 °C and 3,000 psi.