Figures & data
Figure 1. AflaCLEAN Immunoaffinity column.
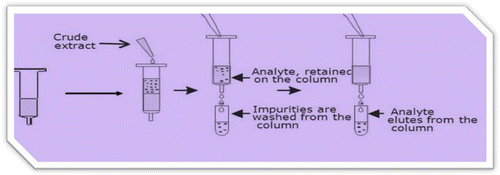
Table 1. Statistics for aflatoxin retention time identification
Figure 2. Chromatographic retention time.
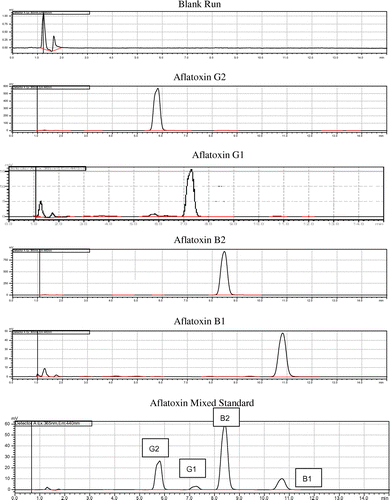
Table 2. Limit of detection (LOD) and limit of quantification (LOQ)
Table 3. Descriptive statistics for precision check
Figure 3. Regression equation vs. the aflatoxins concentration.
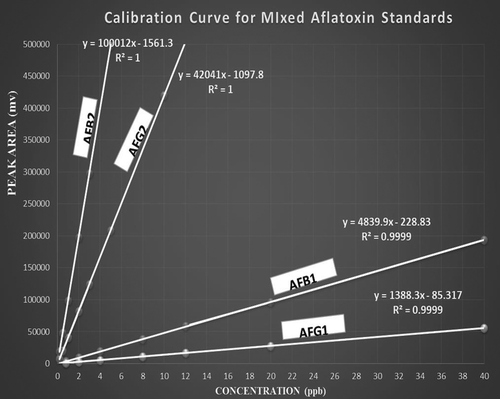
Table 4. Statistics for aflatoxin recovery and accuracy check
Table 5. The Level of aflatoxin in different brands of beer
Figure 4. Standard and sample peaks.
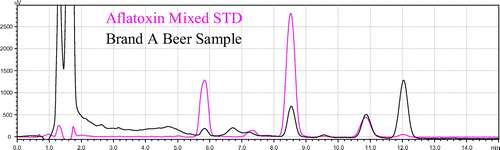
Table 6. Review results for aflatoxins sum in alcoholic and non-alcoholic beer
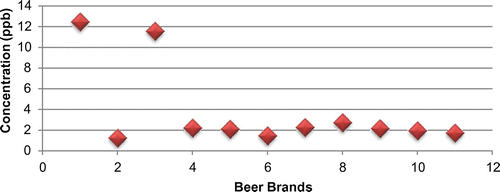
Figure 5. Comparison of brand difference of Ethiopian alcoholic beer.