
Figures & data
Table 1. Impurities present in ripening agents and possible health hazards [Robertson et al., Citation1947, Nadel, et al., Citation1965, Charan et al., Citation1979, Citation1988, Marcus, Citation1990, Segall et al., Citation1991, Kulling et al., Citation1992, Hanif, et al., Citation1995 O'Brien, et al., Citation1998, Pirson, et al., Citation2003, Rahman, et al., Citation2008, Goonatilake, Citation2008, Siddiqui and Dhua Citation2010, Fattah and Ali Citation2010, Hakim, et al., Citation2012]
Figure 1. Ethepon-treated artificially ripened banana.
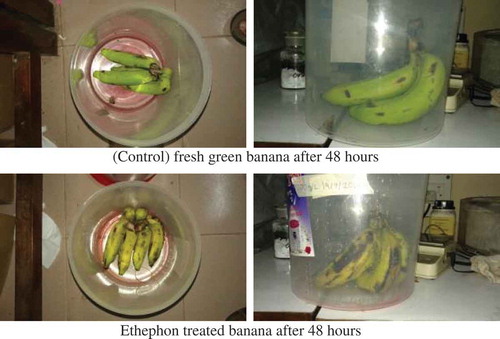
Figure 2. Ripening of carbide-treated banana for 48 h (6 h interval for each frame).
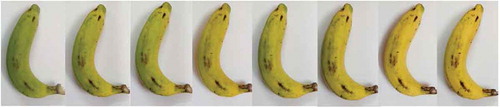
Figure 3. Determination of ripe and unripe banana by iodine staining of starch.
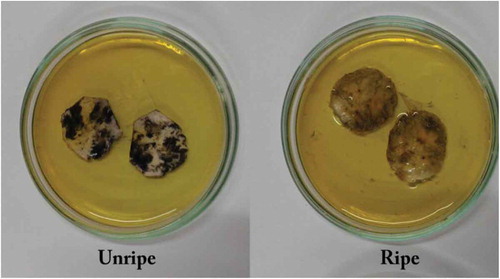
Table 2. Nutrition value of naturally and artificially ripened banana (Bari-1 hybrid banana; Musa Spp.) (Standard deviation for n = 5 samples)
Figure 4. Moisture content of naturally and artificially ripened banana sample (error bars for n = 5 samples).
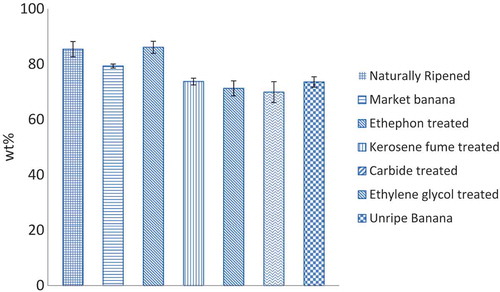
Figure 5. Total titratable acidity of naturally and artificially ripened banana samples (error bars for n = 5 samples).
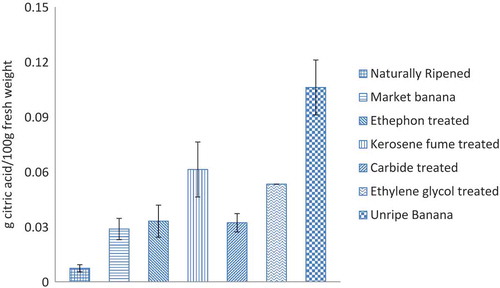
Figure 6. Vitamin C content of naturally and artificially ripened banana samples (error bars for n = 5 samples).
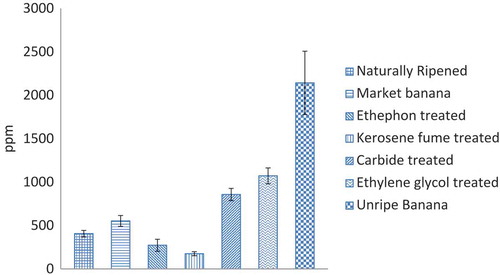
Figure 7. Sugar content of naturally and artificially ripened banana samples (error bars for n = 5 samples).
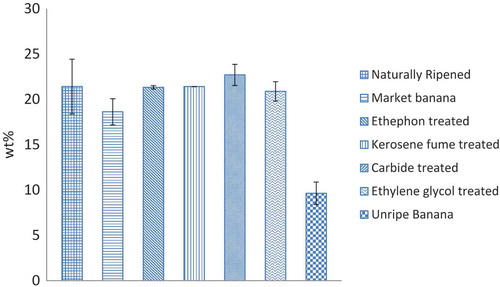
Figure 8. SEM images of calcium carbide used as an artificial fruit ripening agent. (a) 600 times magnification, (b) 1,000 times magnification, (c) 10,000 times magnification, (d) 50,000 times magnification. The high surface area of calcium carbide microstructure ameliorates the formation of acetylene gas when it comes into contact with environmental moisture.
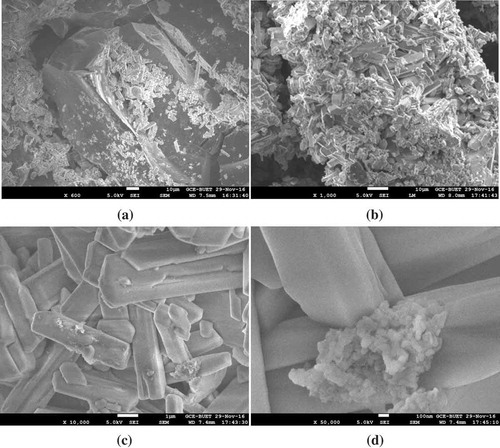
Table 3. X-ray fluorescence spectroscopy analysis of calcium carbide sample
Figure 9. Energy-dispersive X-ray spectroscopy of calcium carbide sample used in artificial fruit ripening.
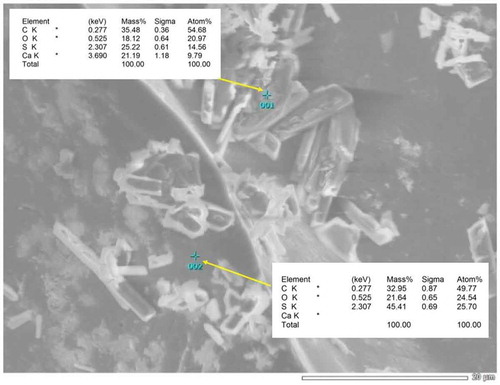
Table 4. Analysis of kerosene fume using a gas analyzer (NOVA model 600–8)
Table 5. S-content in different artificial ripening agents (standard deviation for n = 2 samples)
Table 6. Sulfate and sulfide content of naturally and carbide-ripened banana (standard deviation for n = 3 samples)