Figures & data
Figure 1. Map of Isimani division, Iringa region Tanzania showing location of the study areas.
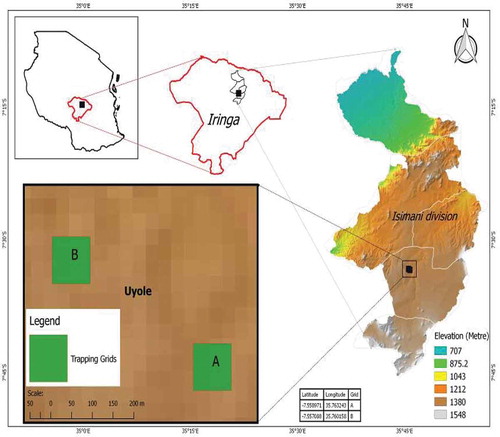
Figure 2. Monthly rainfall patterns for Isimani area in Iringa, Tanzania (day one is equal to 1st of July). Source Courtesy: to Chidodo (Citation2017).
Table 1. Small mammal species composition in maize fields and fallow land in the study area
Figure 3. Mean diet preferences (%) of M. natalensis during the wet and dry seasons in different habitats types (fallow versus maize field). The black bars represent standard errors.
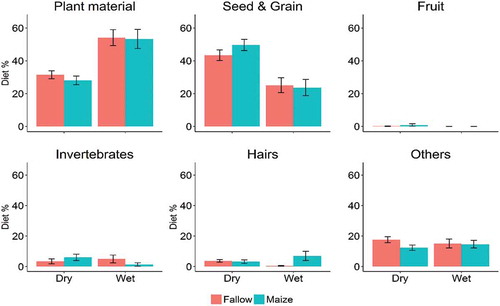
Figure 4. Reproductive activity of female M. natalensis captured in; a: in fallow land and b: in maize field in the study area of Isimani division from June 2015 to July 2017.
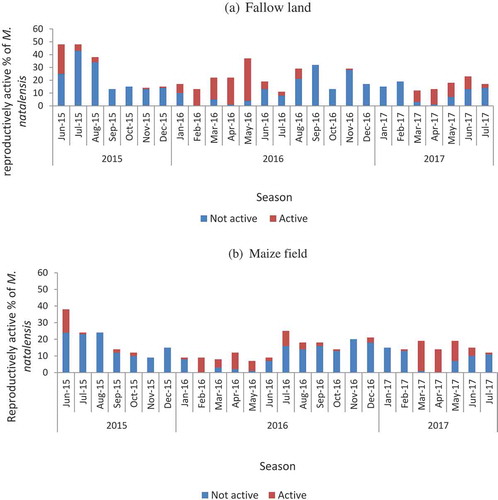
Figure 5. Smoothed spline for the correlation between time of the year and the proportion of reproductively active animals in fallow (black) and maize (red) fields. The solid line represents the mean and the dotted lines the standard errors.
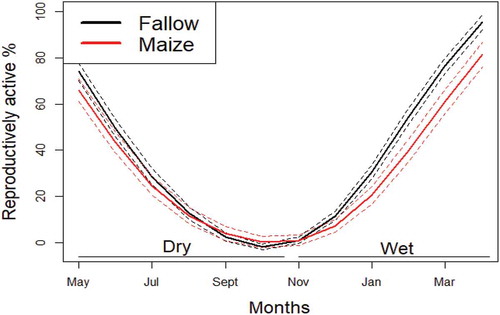
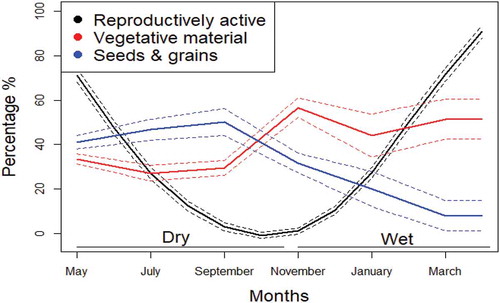
Figure 6. Changes in reproductive activity (black line) of M. natalensis during the year, together with fluctuations in the percentage of vegetative (red line) materials and seed (blue lines) in its diet.